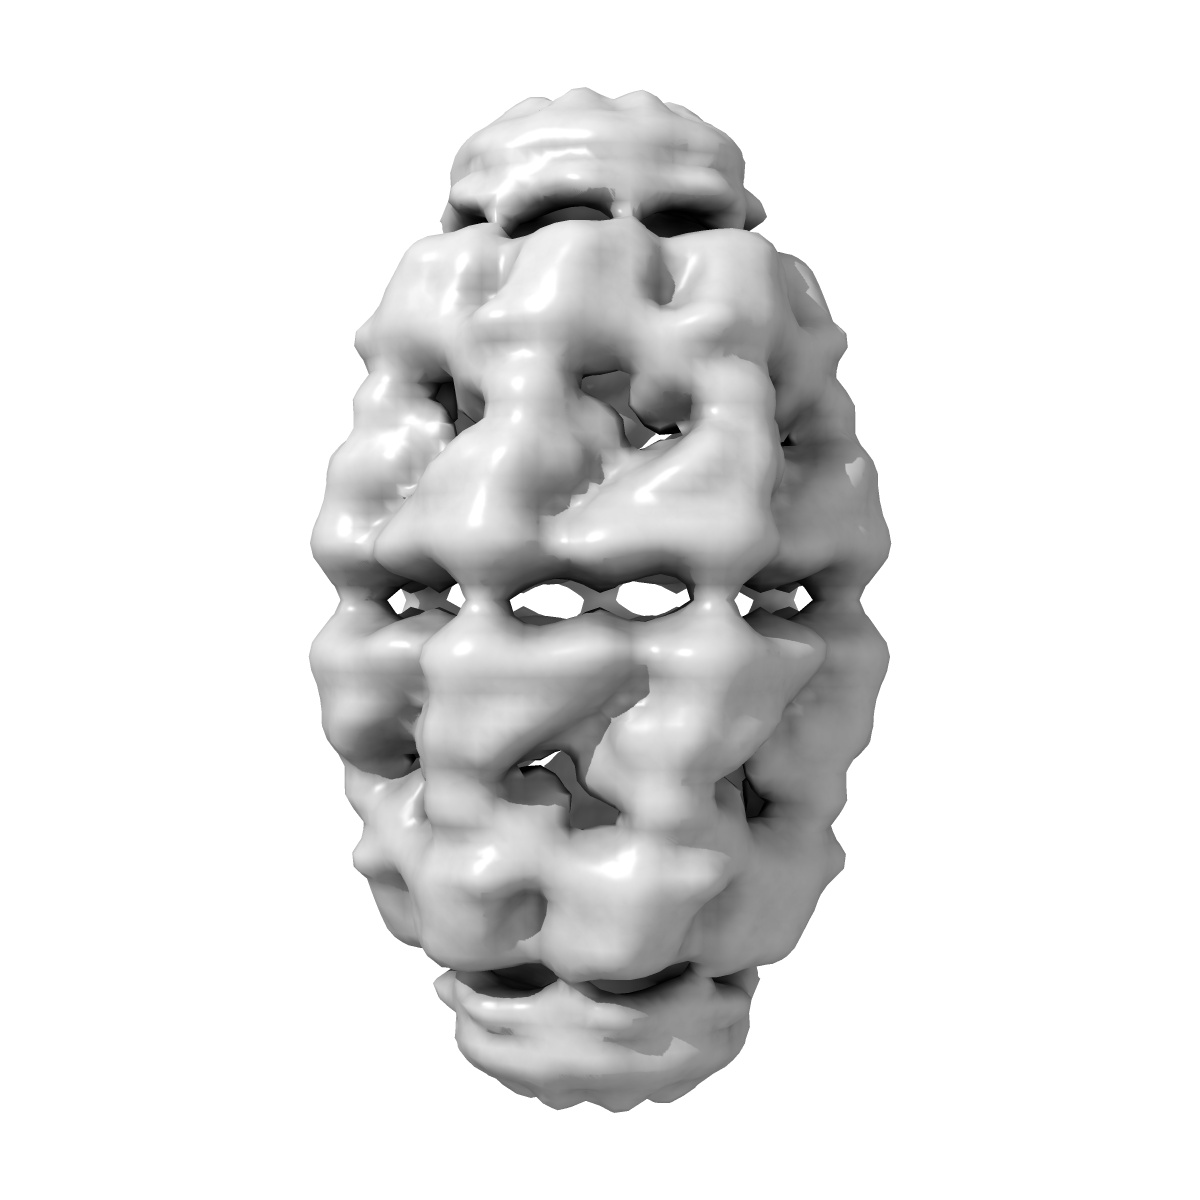
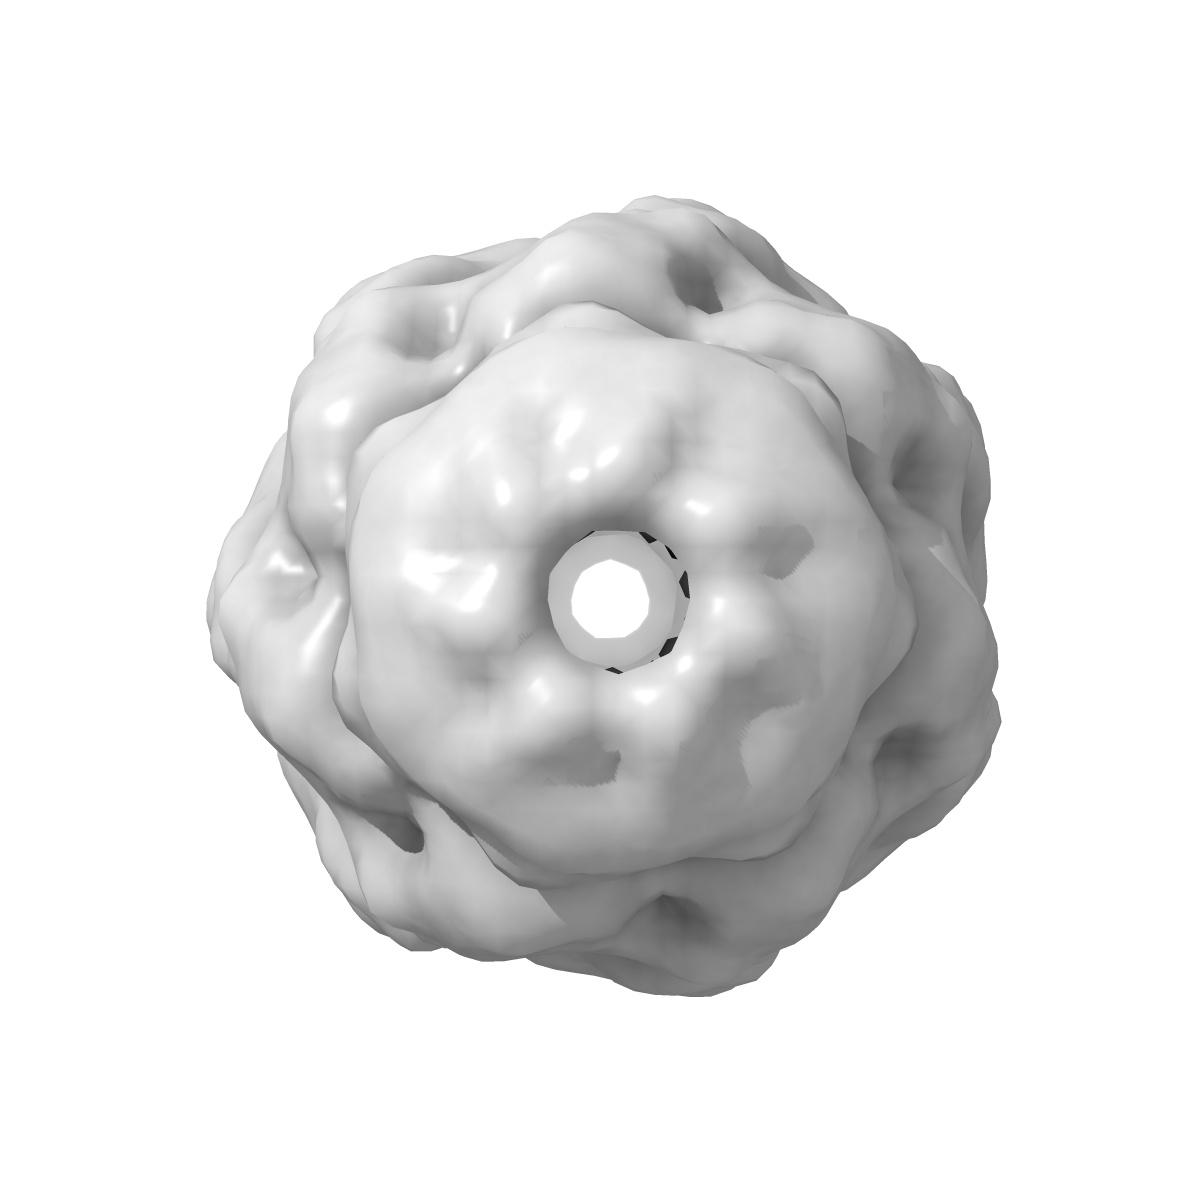
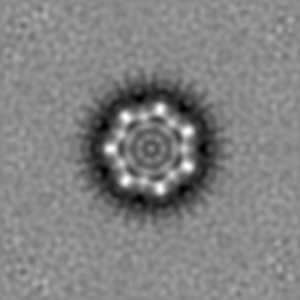
EMD-17426
In situ structure average of GroEL14-GroES14 complexes in Escherichia coli cytosol obtained by cryo electron tomography
EMD-17426
Subtomogram averaging11.9 Å
 Deposition: 23/05/2023
Map released: 03/07/2024
Last modified: 25/09/2024
Sample Organism:
Escherichia coli BL21(DE3)
Sample: GroEL14-GroES14 complex
Fitted models: 8p4r
Deposition Authors: Wagner J ,
Caravajal AI,
Beck F,
Bracher A ,
Wan W ,
Bohn S ,
Koerner R,
Baumeister W ,
Fernandez-Busnadiego R ,
Hartl FU
,
Caravajal AI,
Beck F,
Bracher A ,
Wan W ,
Bohn S ,
Koerner R,
Baumeister W ,
Fernandez-Busnadiego R ,
Hartl FU
Sample: GroEL14-GroES14 complex
Fitted models: 8p4r
Deposition Authors: Wagner J
 ,
Caravajal AI,
Beck F,
Bracher A ,
Wan W ,
Bohn S ,
Koerner R,
Baumeister W ,
Fernandez-Busnadiego R ,
Hartl FU
,
Caravajal AI,
Beck F,
Bracher A ,
Wan W ,
Bohn S ,
Koerner R,
Baumeister W ,
Fernandez-Busnadiego R ,
Hartl FU
Visualizing chaperonin function in situ by cryo-electron tomography.
Wagner J ,
Carvajal AI,
Bracher A ,
Beck F,
Wan W ,
Bohn S ,
Korner R,
Baumeister W ,
Fernandez-Busnadiego R ,
Hartl FU
(2024) Nature , 633 , 459 - 464
,
Carvajal AI,
Bracher A ,
Beck F,
Wan W ,
Bohn S ,
Korner R,
Baumeister W ,
Fernandez-Busnadiego R ,
Hartl FU
(2024) Nature , 633 , 459 - 464
Grant Support: