Interactive data visualisation for Single Cell Expression Atlas
The latest Single Cell Expression Atlas expands its metadata search allowing users to search across cell types, organism parts and biological condition in addition to the existing gene search.

Using powerful data visualisation and interactive search results across datasets allows users to explore hypotheses across a range of metadata, and discover new insights backed by expertly curated, consistently reanalysed single cell sequencing data.
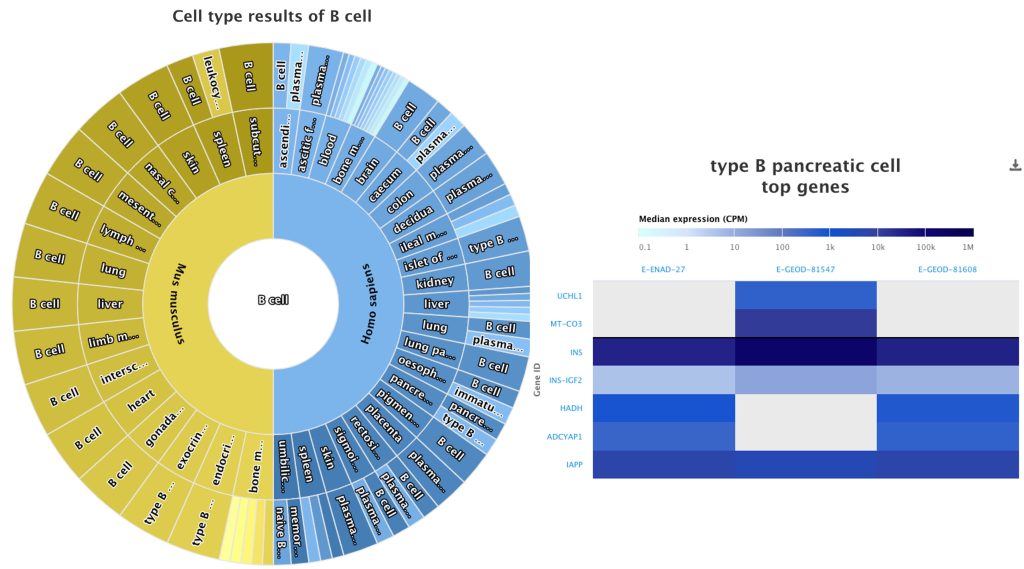
Searching for metadata, allows a powerful ontology-driven search expansion to return all related searches to the entity of interest. Typing a term in the search bar returns a dropdown option showing either genes or metadata options. Selecting a metadata term redirects users to an interactive search wheel returning all results for that entity across the current range of 20 species and component organism parts. Here is an example search for B cells.
Alongside each metadata search result is a marker gene heat map for cell types of interest across each dataset in which that term is mentioned. To visualise this, select an entity on the outermost edge of the wheel. This feature allows users to explore marker genes for specific cell types across multiple datasets looking for commonalities or differences. All visualisations are free to download and reuse under a creative commons license.