LigPlot+ v.2.2 - ligand-protein interaction diagrams

LigPlot+ is a successor to our original
LIGPLOT program for automatic generation of 2D ligand-protein
interaction diagrams. It is run from an intuitive java interface which
allows on-screen editing of the plots via mouse click-and-drag
operations.
In addition to the new interface, the program includes several major
enhancements over the old version:
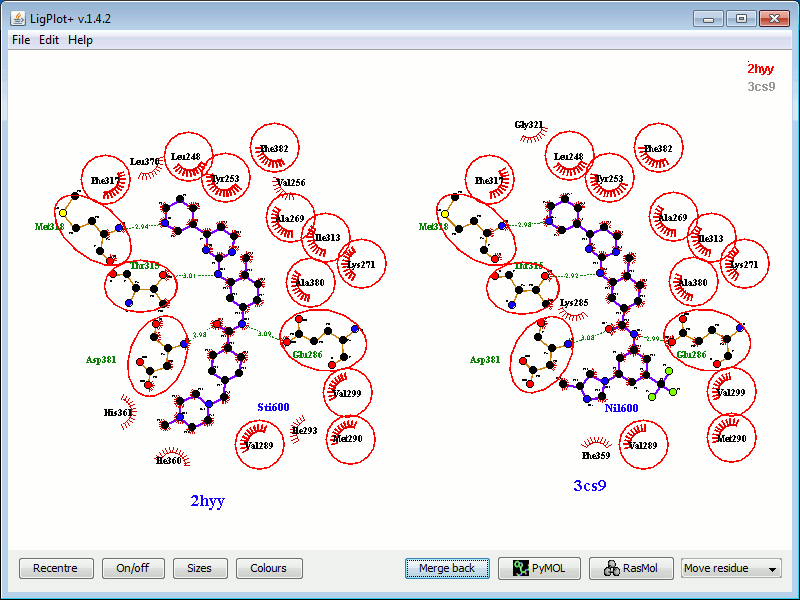
- Superposition of related diagrams. When two or more
ligand-protein complexes are sufficiently similar,
LigPlot+ can automatically display their interaction
diagrams either superposed or side by side. Any conserved interactions
are highlighted (see example below). More examples can be found
in our original publication (below), as well as here.

|
|
Overlaid plots
|
|
|

|
|
Split plots
|
Binding sites of two structural models of the same protein
complexed with two different ligands (click to enlarge). The
protein is human c-Abl tyrosine kinase, and the two ligands are
imatinib (PDB entry 2hyy) and nilotinib (3cs9). The ligands and
protein side chains are shown in ball-and-stick representation,
with the ligand bonds coloured in purple. Hydrogen bonds are shown
as green dotted lines, while the spoked arcs represent protein
residues making nonbonded contacts with the ligand. The red
circles and ellipses indicate protein residues that are in
equivalent 3D positions when the two structural models are
superposed.
|
- Improved DIMPLOT program. The LigPlot+
suite also now includes an update of the original DIMPLOT
program for plotting protein-protein or domain-domain
interactions. Users can flexibly select the interface of interest and
DIMPLOT will then generate a diagram showing the
residue-residue interactions across the interface. To assist in
interpretation, the residues in one of the interfaces can be
optionally displayed in sequence order. Note that the DIMPLOT
module does not yet allow multiple plots of related interfaces.

|
|
DIMPLOT interface diagram
|
Residue-residue interactions across the protein-protein interface
of chains B and C in PDB entry 1swo (a streptavidin mutant). Click
to enlatge).
|
- Links to PyMOL and RasMol. The 3D representation of any
LIGPLOT diagram can be viewed in either PyMOL or
RasMol with all the interactions indicated.

|
|
RasMol 3D view
|
A RasMol 3D view of the ligands in the first example above,
superposed in 3D (click image to expand). The ligands are shown with
thick stick, while the residues interacting via H-bonds are shown as
thin sticks. H-bonds are shown in cyan. The dotted surfaces
correspond to the parts of residues that inter4ct with the ligand
via non-bonded contacts only.
|
Reference
Laskowski R A, Swindells M B (2011).
LigPlot+: multiple ligand-protein interaction diagrams for drug discovery.
J. Chem. Inf. Model., 51, 2778-2786.
[PubMed id: ]
Availability
Academic Licences
Available free. To receive a licenced version of the
programs, please go to:
Academic licence.
Commercial Licences
For commercial licences please see Chemogenomix.
Last modified: 13 Jul 2012
| 


