LigPlot+ v.2.2
Graphical User Interface for the LIGPLOT and DIMPLOT programs
Operating Manual
Contents
Contents
The very first time you run LigPlot+ after installation, you will need to define several paths and directories so that the program knows where to find things like PDB files, the Het Group Dictionary and the RasMol/PyMOL programs (if you have them). LigPlot+ will detect that it is being run for the first time and will pop up an entry-form, described in the section below, for you to fill in.
Note that it is particularly important that the directory you enter for the Temporary directory exists on your computer and is writable, otherwise the program will not run.

|
Edit the text fields as follows:
i. PDB paths
PDB files are most conveniently identified simply by the 4-character
PDB code or identifier. If your system contains one or more locations
where PDB files are stored, you can define a "template" path which
will allow LigPlot+ to find the relevant PDB file
from its 4-character code alone. The files can be gzipped or not.
Alternatively, if you are connected to the internet when you run LigPlot+, the required file can be retrieved by ftp from a given ftp site.
The 4 characters of the PDB code in each template are represented as abcd. These appear in the template within square brackets.
For example, the template
C:/roman/pdbsum/pdb/pdb[abcd].entmeans that, for example, PDB code 1ral would be translated as:
C:/roman/pdbsum/pdb/pdb1ral.entSimilarly, the ftp template
ftp://ftp.ebi.ac.uk/pub/databases/rcsb/pdb-remediated/data/structures/divided/pdb/[bc]/pdb[abcd].ent.gzwould map to PDB code 1ral as:
ftp://ftp.ebi.ac.uk/pub/databases/rcsb/pdb-remediated/data/structures/divided/pdb/ra/pdb1ral.ent.gzNote that here the PDB files are stored in subdirectories whose names correspond to the middle part of the PDB code (here shown as "[bc]").
The above ftp address retrieves gzipped PDB files from the PDBe ftp site at the EBI. A full list of possible ftp addresses is given below:
You can add others if you wish.
PDBe ftp://ftp.ebi.ac.uk/pub/databases/rcsb/pdb-remediated/data/structures/divided/pdb/[bc]/pdb[abcd].ent.gz PDBj ftp://ftp.pdbj.org/pub/pdb/data/structures/divided/pdb/[bc]/pdb[abcd].ent.gz RCSB PDB ftp://ftp.wwpdb.org/pub/pdb/data/structures/divided/pdb/[bc]/pdb[abcd].ent.gz
ii. The Het Group Dictionary
LigPlot+ gets its information about ligand molecules
from the Het Group Dictionary. This defines the atom names,
connectivities and bond orders of every Het Group in the PDB. You can
download a copy of this dictionary from the wwPDB at:
https://files.wwpdb.org/pub/pdb/data/monomers/components.cif
It is a good idea to download it regularly to always have an up-to-date copy.
Record the full path and filename of the Het Group Dictionary here so that the programs know where to find it. If you have a ligand that is not in the dictionary, you can define the ligand in your own version of the dictionary or in a .sdf file (see below).
SDF Dictionary. If your ligand definitions are in a .sdf file, you can provide the name of your file here in place of the Het Group Dictionary. There are two important considerations:
iii. Temporary directory
LigPlot+ needs a directory where it can put its temporary
working files (which it deletes once it has done with them). Use this
parameter to define such a directory. The directory must be present
on your computer and have write permissions that allow you to write to
it.
The default location for Windows is C:\tmp, and for linux /tmp. If these directories do not exist on your system, you need to either create them or change the path to directories that do exist.
iv. Name of RasMol executable
Enter the full path and name of the RasMol executable file. This will
allow you to display the 3D coords of the given LIGPLOT/DIMPLOT
diagrams. If you do not have RasMol, enter NONE here, although it is recommended that
you download and install a copy of the program.
Linux users might find it more convenient to enter the RasMol path using the following format:
xterm -e rasmol -scriptThis will open up an X-term window as well as a RasMol window. The former can be used for entering RasMol commands.
v. Name of PyMOL executable
Similarly, if you have PyMOL installed, enter the full path and name
of the executable here. As in the RasMol option, this will allow you
to display the 3D coords of the given LIGPLOT/DIMPLOT
diagrams. If you do not have PyMOL,
enter NONE here.
Save
 | Once you have entered all the parameters, press the Save button to store your paths. |
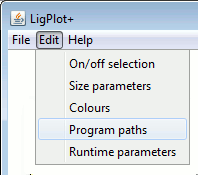
Should you need to alter the paths at some later date, you can do so via the Program paths menu item in the Edit menu:
|

|
|
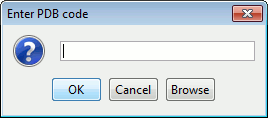
Alternatively, you can click the browse Browse button for a PDB file in your local directory system.
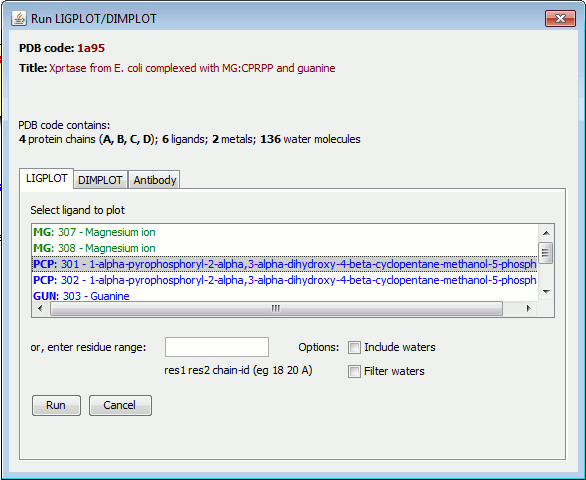
When the file has been loaded, you will see a summary of the ligands and metals in the PDB file, if any, as shown below for PDB entry 1a95.
Clicking on the LIGPLOT, DIMPLOT or Antibody tabs allows you to choose which of the programs is to run.
|
Alternatively, you can enter your own residue range in the "residue range" box. The residue range can be one of the following:
| Example | Description | |
| 18 20 A |
Residue range: start-residue-no. end-residue-no. chain-id If the chain-id is blank in the PDB file it should be omitted here |
|
| NAG 18 MAN 20 A | Residue names and numbers, plus chain id. | |
| -n818 108 -n818 108 A | Where the residue name is numeric, prefix it with "-n" to indicate that it is the residue name rather than the residue number. | |
| "MTE" 1 " G" 2 B | Where a residue name includes leading blanks (eg as in the old definition of the nucleic acid bases, A, C, G and T), enclose it in quotes and include the spaces. | |
| "-nMTE" 1 "-n G" 2 B | An alternative for the case above. |
|
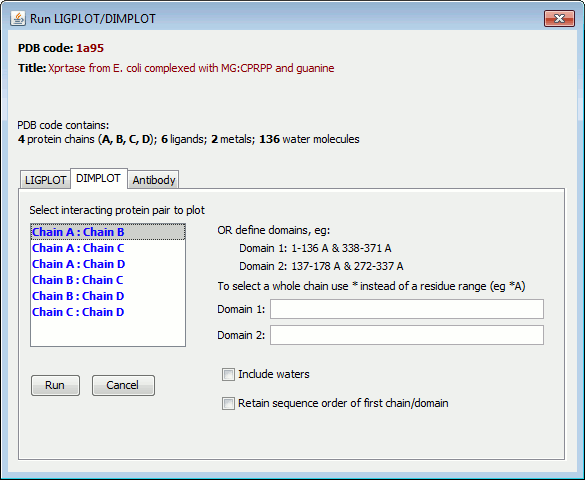
Alternatively, you can define the two chains (or domains) by entering their residue ranges into the two field-boxes labelled "Domain 1" and "Domain 2" on the right.
Each residue range should be entered as: n1-n2 C, where n1 is the start residue number, n2 is the end residue number, and C is the chain id.
If a domain is split into several residue ranges, you need to list them all, separating each range by an ampersand. For example, a domain comprising residues 1 to 136 and 338 to 371 of chain A, would be defined as:
1-136 A & 338-371 AA domain can consist of residue ranges from more than one chain.
To define a whole chain, prefix the chain-id with an asterisk, eg *A. So, for example, to plot the interface between chains A and B, you could enter:
Domain 1: *A Domain 2: *B
|
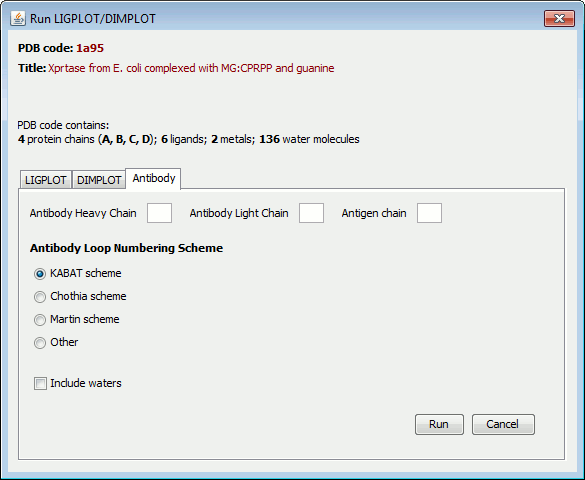
If the PDB file contains chains H and L, the program will suggest these to be the heavy and light chains, respectively. If it finds a third chain that interacts with both chains H and L it will suggest it as the antigen.
The "Other" option will not assign residues to loops and will not given them different colours. You can still assign unique colours to single residues, or groups of residues, as described in section 4h below.
Then, to generate the plot, click on the Run button.
i. LIGPLOT
When the plot has been generated it will appear on screen as shown below. This shows the PCP 301 ligand in PDB entry 1a95.

Key
The meaning of the items on the plot is as follows:

You can change colours, sizes, etc as described later.
Sometimes a plot contains thin purple lines. These are either covalent bonds between protein and ligand, or "elastic" bonds within the ligand. The latter occur when the ligand is a cyclic peptide; the program has to make one of the bonds "elastic" in order to be able to flatten the ligand into 2D.
ii. DIMPLOT
A DIMPLOT diagram will show the interactions across an interface, as shown below for chains A and C in PDB entry 1n8z.
The horizontal dashed line represents the interface. It can be moved up and down; its left and right ends adjust automatically according to the positions of the leftmost and rightmost residues.
If the interface is an extended one - which would make it very long and narrow if plotted in a single line - it is split into two segments, shown one below the other, as for chains A and C in PDB entry 4epe:
iii. Antibody plot
Below is an example of an antibody plot for PDB entry 1bj1.
As in the DIMPLOT example abive, the interface has been split into two, with the two parts shown one above the other. The two horizontal dashed lines correspond to the interface.
The residues below the line belong to the antibody, with each of the heavy- and light-chain loops shown in a different colour and labelled H1, H2, H3 and L3. The residues have been assigned to loops using the Kabat numbering scheme (antibody loops L1 and L2 do not interact with the antigen, and so are not shown) and are plotted in sequence order. Above the dashed line are the interacting antigen residues, coloured pink.
Note, that to switch between moving whole residues and single atoms click the Move residue/move atom button at the bottom-right of the frame to toggle between the two modes.

|

|
Hydrophobic contact groups cannot be moved in the Move atom mode.
Use the right mouse button to click-and-drag on any blank area of the plot to zoom in and out of the plot.
Note for mac users. If your mouse only has a single button, use the SHIFT key with your button-click to get the same functionality as a right button click.

|
|
|
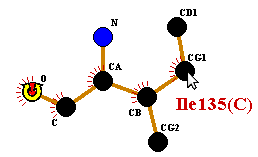
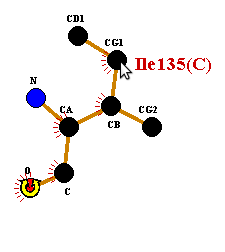
To rotate, click-and-drag any other atom in the residue. Release the button when you have reached the desired position.
To deselect the atom, click on any blank part of the plot, or on any other residue.
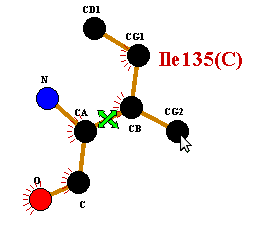
Firstly, select the bond by clicking on it with the right mouse button. A marker will appear over the selected bond.
|

|
To flip about this bond, click with the left mouse-button on any atom on the side of the residue to be flipped. A single click will perform the flip. Clicking a second time on any of the flipped atoms will reverse the flip.
To "unselect" the flip-bond, click on any blank area of the plot and the marker will disappear.
Select the text item by right-clicking on it. A box containing the text string will appear. You can edit the text as required. Click the OK button to accept the new version, or the Cancel button to retain the previous text label.
You can use this option to remove any text labels: just delete the text in the box. However, what if you have done this by accident, or want to reinstate a previously deleted label? There is no longer anything to click on! The solution is to click the On/off button (described below) and select the "Show blank labels as hyphens" checkbox. The missing labels should now be visible as hyphens and clickable.

|
Clicking it will undo the previous move or text edit. Up to 10 moves are stored, so that is how many moves can be undone.

|
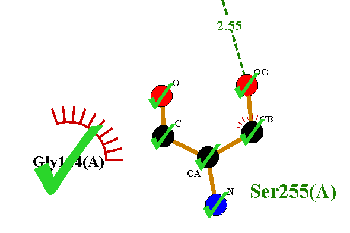
Whenever you click a residue in this mode, one or more green ticks will appear to show it has ben selected. Clicking the same residue a second time unselects it and removes the ticks. The residues cannot be moved in this mode.
|
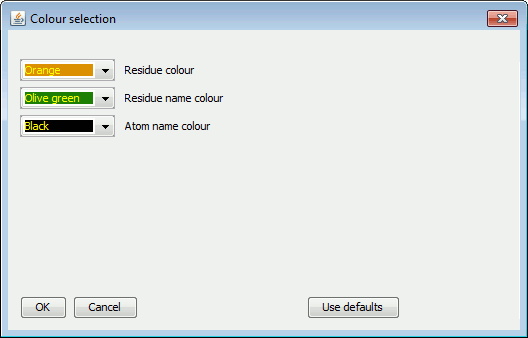
To change the colours of the bonds or labels of the selected
residues, click the  button and the
colours panel will pop up:
|
Choose the colours as required. They will be applied to the selected residues, overriding their current ones. To revert to the originals, click Use defaults.
For example, you might wish to plot several structures of the same protein with a different ligand bound. Or similar proteins with the same or similar ligands bound. Alternatively, it might be useful to see the interactions the same ligand makes when binding to completely different proteins.
After the plots have been generated and overlaid, you can edit them by moving their components independently and switching between them. The currently active plot is shown in full colour in the foreground, while all background plots are greyed out. Before printing you can "switch off" the display of the background plots such that only the foreground plot appears. This allows you to produce a set of clean plots with equivalent components in equivalent positions on them. Alternatively, if you use the "Write PostScript" option, you can have each plot printed on a separate page.
The first plot is generated in the usual way. Each subsequent plot is fitted to the first by a sequence alignment between the two proteins (in the case of LIGPLOT) or between the first chains/domains (in the case of DIMPLOT/Antibody plots). The alignment identifies equivalent residues in the 3D structures and these equivalences drive the generation of the second LIGPLOT/DIMPLOT/Antibody plot.
For LIGPLOT, if the program is unable to successfully align the sequences, it tries to fit the ligands using a graph matching procedure. For very distantly related proteins it is better to use a structural alignment. Section 7 describes how to import such an alignment.
|
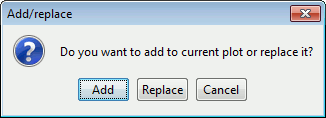
The new plot, when generated, will become the foreground plot; any current plot(s) will go into the background.
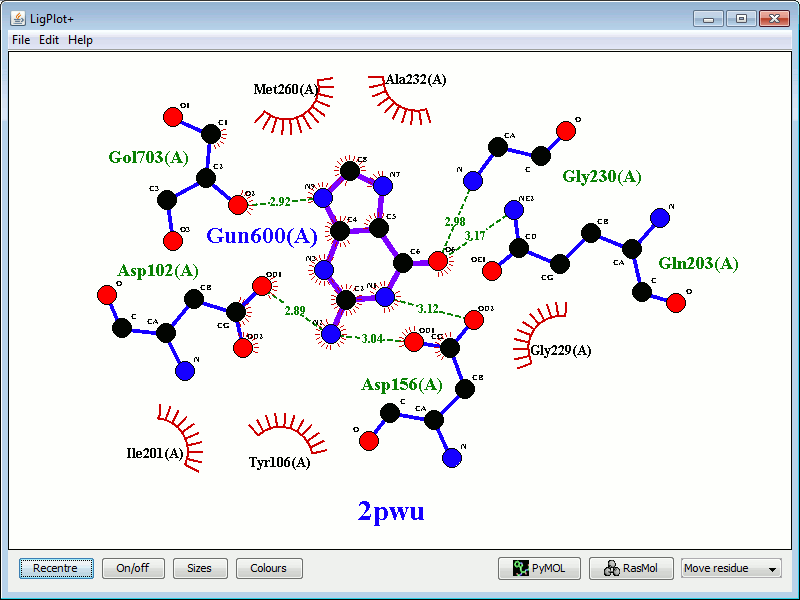
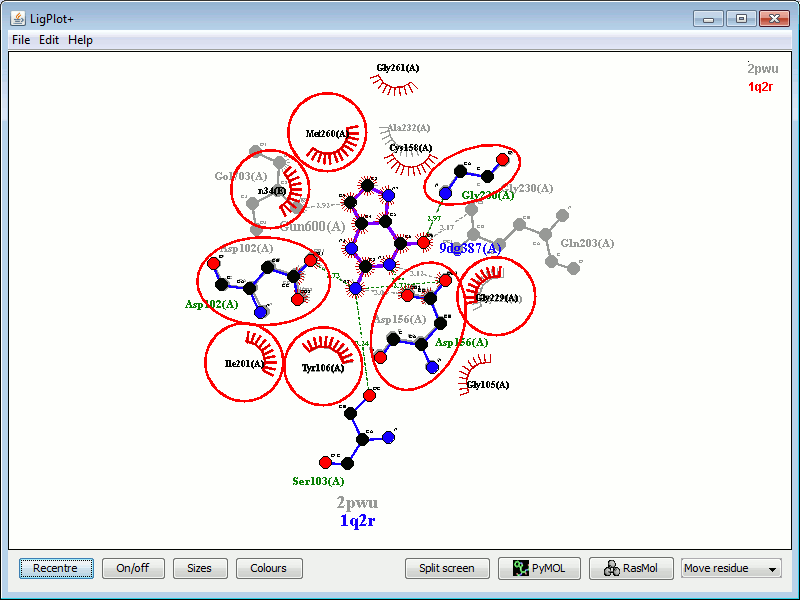
In the example below, the left-hand plot shows the interactions between guanine 600 in PDB entry 2pwu and the protein residues. The right-hand plot shows, superposed on it, a plot of a similar molecule (9DG) bound to the same protein, in PDB entry 1q2r. The red circles and ellipses identify the residues on the latter plot that are equivalent (in the 3D superposition of the structures) to the underlying residues from the first plot.
|
|
LigPlot+ attempts, as best it can, to place residues in the new plot on top of the equivalent residues in the old one. It does this by first performing a simple sequence alignment between the set of interacting residues from each structure. The equivalenced residues in this alignment are then used to superpose the 3D coordinates from both PDB files. This may throw up more pairs of equivalenced residues, being those that significantly overlap in the superposition. The residue equivalences are then used to "drive" the generation of the new LIGPLOT diagram; the 2D locations from the first plot restrain the positions of the corresponding residues in the second.
The superposition may not always be successful if either the two proteins are quite different, or the second ligand is very large relative to the first.
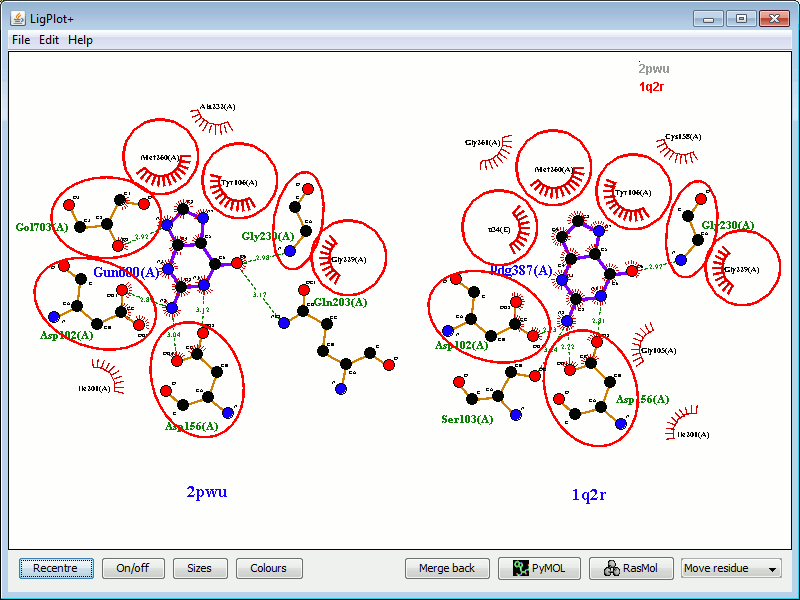
The "Split screen" button at the bottom of the frame separates the two (or more) plots, and arranges them in the window.

|
Two plots, as in the above example, are shown side by side:
|
The "Merge back" button will restore the plots to overlap mode.
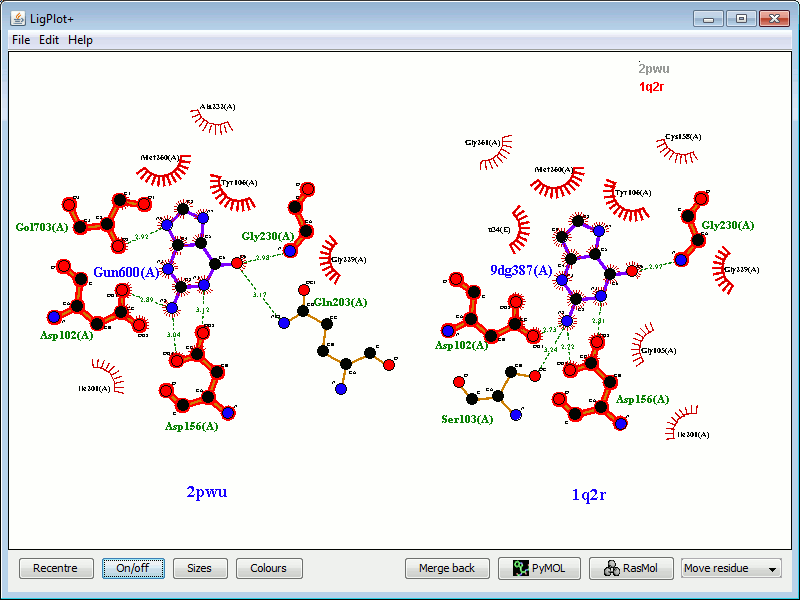
An alternative to the red ellipses for identifying equivalent residues is shown below.
|
Here, the equivalent residues have a red underlay beneath their bonds and atoms. Equivalent residues engaged in hydrophobic interactions are shown in thicker lines.
Use the On/Off parameters to switch between the ellipse and underlay methods of depiction by checking/unchecking the "Circle equivalent side chains" and "Highlight equivalent side chains" options, respectively.
Inverting the highlights
In some cases it might be useful to highlight the protein residues that differ between the plots, rather than those that are equivalent. Again, go to the On/Off parameters, this time checking the "Invert to highlight non-equivs instead" option.

|
You can then move any of the plots on screen by clicking and dragging any of their components (ie atoms, bonds, text items, etc). Remember to revert to "Move residue" mode when you're done to return to normal editing. When you merge the plots back, the "Move plot" option is lost.

|

|
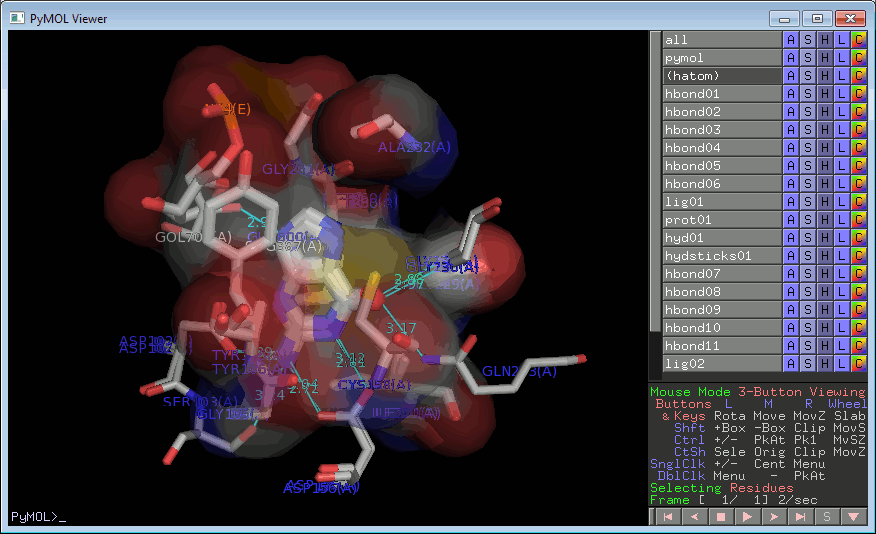
Clicking on one of these buttons will pop up a RasMol or PyMOL window containing the superposed ligands, in 3D, with H-bonds added in cyan and atoms involved in non-bonded contacts represented by dot surfaces (in RasMol) or transparent surfaces (in PyMOL).

|
|
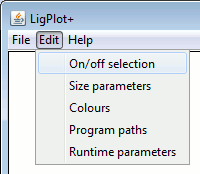
|

|
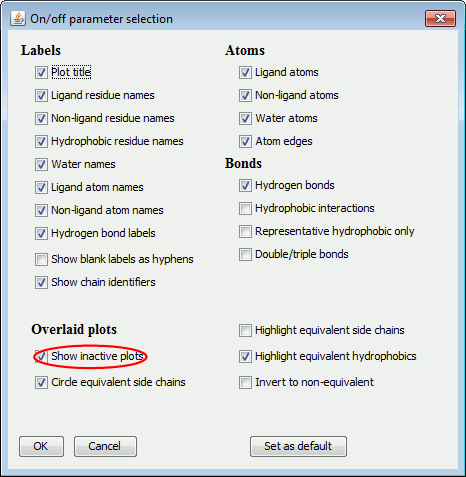
Then, deselect the Show inactive plots option, circled in red below.
|

|
|
|
|||

|

|

|
|||
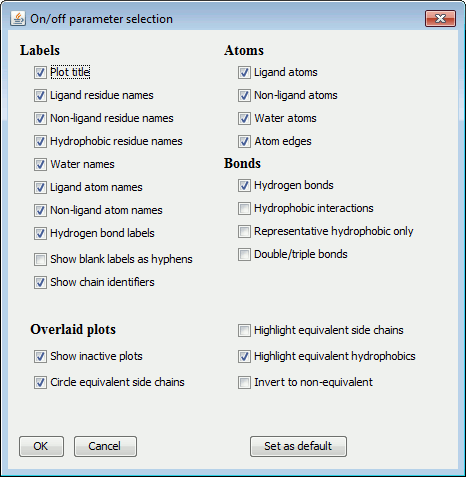
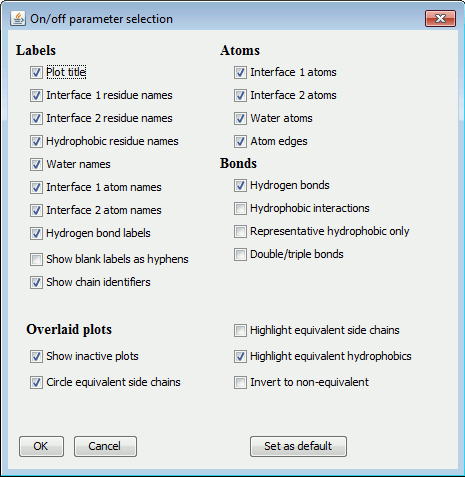
If you have two or more plots overlaid, there is an extra checkbox (see example on the left below) which allows you to apply the new parameters to the currently selected plot only, or to all plots. Thus you can, say, have the bonds or labels shown in a different colour in each plot. The background parameters always apply to all plots.
|
|
The items are grouped into: Labels, Atoms, Bonds and Miscellaneous.
|
|
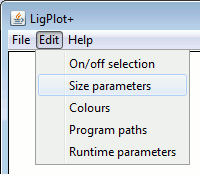
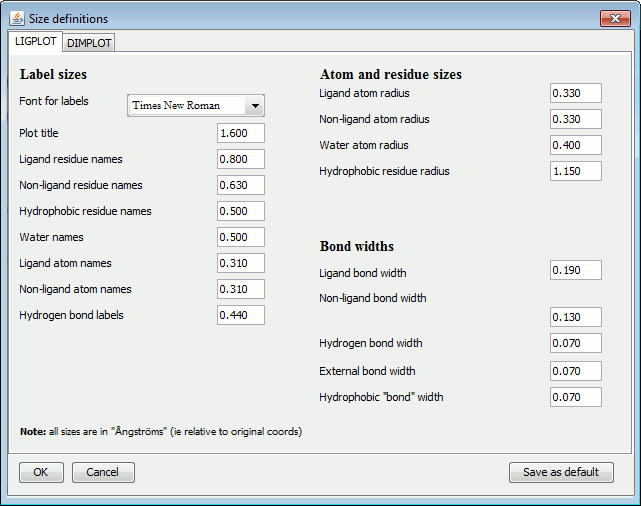
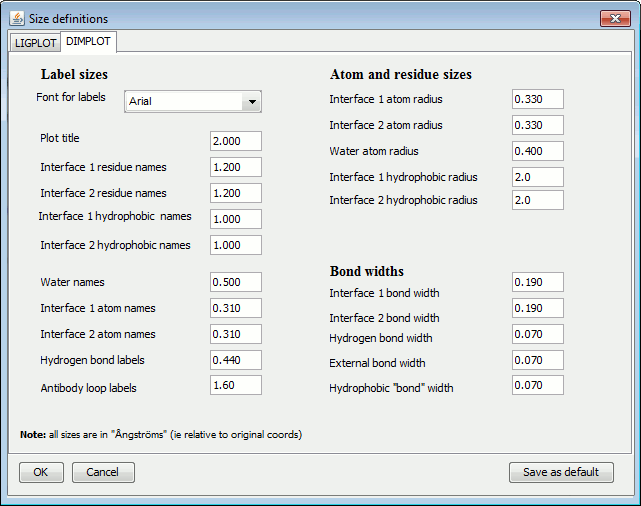
The items are grouped into: Label sizes, Atom and residue sizes and Bond widths.
The left-hand panel above shows the LIGPLOT options while the right-hand panel contains the DIMPLOT and Antibody plot options.

|
|
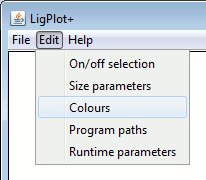
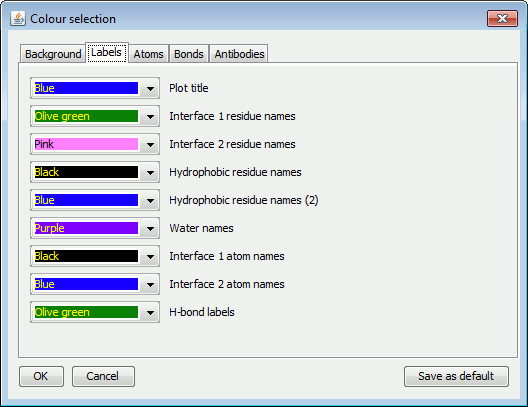
Background, Labels, Atoms, Bonds and Antibodies.The left-hand panel above shows the Labels colour options for LIGPLOT while the right-hand panel contains the corresponding DIMPLOT and Antibody plot options.
Note that, for ligand and non-ligand Bonds there is a special extra colour labelled "ATOM". If this "colour" is selected, the bonds will be coloured such that each half is of the colour of the atom bonded at that end.
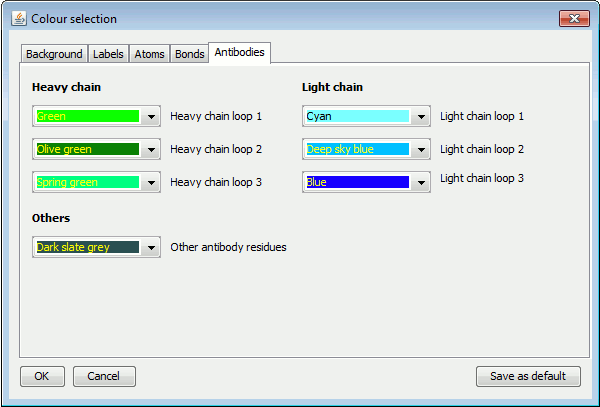
The Antibodies tab defines the colours for each antibody loop when plotting antibody-antigen plots, as shown below.
|
|
|
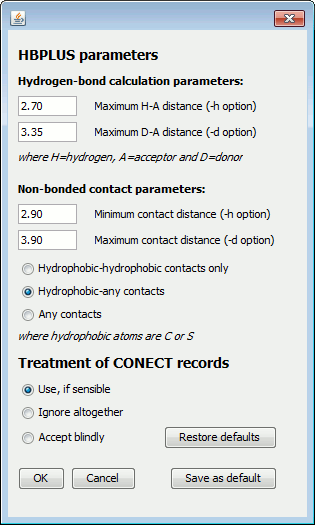
The four numeric parameters relate to the HBPLUS program used by LigPlot+ to compute all the potential hydrogen bonds and non-bonded contacts. The first two values correspond to the maximum hydrogen-acceptor and donor-acceptor distances for defining what is a hydrogen bond. By increasing these values you can "bring in" additional interactions which may be just outside the program's criteria for an H-bond.
The next two numeric parameters correspond to the range of distances defining non-bonded contacts (ie contacts between atoms that are neither covalently bonded, nor interacting via hydrogen bonds). The default range is 2.9-3.9 Å
Below the numeric parameters are two groups of radio buttons. The first set allows you to specify which atom-atom contacts are to be included as non-bonded contacts: a) between hydrophobic atoms only (ie C or S), b) between a hydrophobic atom and any other, or c) between any type of atom.
The second group of radio buttons relates to the treatment of any CONECT records that may be in your PDB file. The CONECT records define which atoms are covalently bonded to one another. They are generally used for defining the connectivity of the ligand. Sometimes, these records are incorrect and give unfeasibly long bonds.
You can choose how the program should treat the CONECT records. The default is to use them if they look sensible - that is, if they don't give ridiculously long bond lengths. The second option is to ignore these records altogether; the program will compute the ligand's covalent bonds itself, using set distance cut-offs. The third option is to accept all CONECT records, irrespective of the bond lengths they give.
If you need your plot to have an H-bond that HBPLUS has missed, you can add it as follows:
The format of each "HHB" or "NNB" record should be formatted exactly as shown below, where the dots represent blank spaces.
Key   <----Atom 1 --->     <----Atom 2 --->    Dist
HHB...RRR.C.NNNNI.AAAA.....RRR.C.NNNNI.AAAA....DDDD
| where | HHB | defines the record type: HHB for H-bonds, NNB for non-bonded contacts | ||
| RRR | is the 3-character residue name | |||
| C | is chain identifier (which may be blank) | |||
| NNNN | is the right-justified residue number (1-9999) | |||
| I | is the insertion code, or blank if none | |||
| AAAA | is the 4-character atom name in standard PDB format | |||
| DDDD | is the distance between the two atoms (to 2 places of decimals) | |||
Some example lines are given below:
HHB...RRR.C.NNNNI.AAAA.....RRR.C.NNNNI.AAAA....DDDD
HHB   HIS A  231   N       ASP A  226   OD2    2.77
HHB   HIS A  231   ND1     ASP A  226   OD1    2.76
HHB   HIS A  231   NE2     THR A 1317   O      2.80
HHB   THR A 1317   N       ALA A  113   O      2.72
HHB   ALA A  113   N       PHQ A  317   O2     3.31
So, for example, to remove the H-bond between the NH2 of Arg286(A) and the O7 of your ligand, LIG1(B), you would add the following line to your PDB file:
-HB...RRR.C.NNNNI.AAAA.....RRR.C.NNNNI.AAAA....DDDD
-HB   ARG A  286   NH2     LIG B    1   O7     0.00
One way to help the program is to supply it with a structural alignment between the proteins, letting it know which residues are equivalent in 3D.
At present, LigPlot+ only accepts structural alignments in the following formats:
Import the alignment
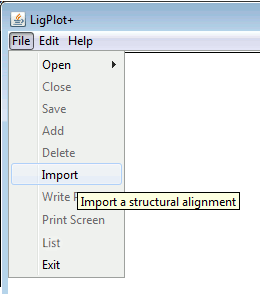
Import using File-Import from the menu bar.
|
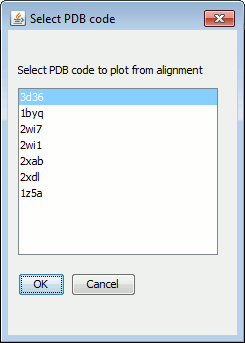
A pop-up window will show you the list of PDB codes in the file and allow you to select which one you want to plot first.
|
After the first plot has been generated, you can add others on top of it via either File-Add or File-Open-PDB file.
1. CORA format (.cora or .aln)
The format must be CORA v.1.1, which is as follows:
#FM CORA_FORMAT 1.1
3
6insE0 1igl00 1bqt00
73
   1    0    1    0  0  0    1  A  0    0  0  0   0    0    0   0
   2    0    1    0  0  0    2  Y  0    0  0  0   0    0    0   0
   3    0    2    1B F  0    3  R  0    0  0  0   0    0    0   0
   4    0    3    2B V  H    4  P  0    1  G  0   0    1    0   2
   5    1    3    3B N  H    5  S  0    2  P  0   0    1    0   6
   6    0    3    4B Q  H    6  E  0    3  E  0   0    1    0   2
   7    2    3    5B H  H    7  T  0    4  T  0   0    1    0   5
---------+---------+---------+---------+---------+---------+---------+
1234567890123456789012345678901234567890123456789012345678901234567890
         1         2         3         4         5         6         7
     START       PROT 1     PROT 2     PROT N         END
<------------><---------><---------><---------><---------------->
ddddxddddxddddxddddcxcxxcxddddcxcxxcxddddcxcxxcxxxcxddddxddddxxdd

   1    0    1    0  0  0    1  A  0    0  0  0   0    0    0   0
   2    0    1    0  0  0    2  Y  0    0  0  0   0    0    0   0
   3    0    2    1B F  0    3  R  0    0  0  0   0    0    0   0
   4    0    3    2B V  H    4  P  0    1  G  0   0    1    0   2
   5    1    3    3B N  H    5  S  0    2  P  0   0    1    0   6
   6    0    3    4B Q  H    6  E  0    3  E  0   0    1    0   2
   7    2    3    5B H  H    7  T  0    4  T  0   0    1    0   5
---------+---------+---------+---------+---------+---------+---------+
1234567890123456789012345678901234567890123456789012345678901234567890
         1         2         3         4         5         6         7
where
2. CAF format (.caf)
This is one of the formats output by the CATHEDRAL structural alignment program.
HH CATHEDRAL Alignment 2.02
CC Date:    Tue Feb 22 21:07:49 2011
CC Author:  cathedral
CC Protein1 Protein2 Len1 Len2 Score  Align %Ov  %Seq RMSD
RR   1byq    2wi7  213  209  93.05  208   97   99   1.38
RR   1byq    3d36  213  121  72.64  115   53   17   9.95
RR   2wi7    3d36  209  121  72.58  114   54   16   9.68

                 1         11        21        31        41        51
pdb|3d36         --------------------VDIQATLAPFSVIGEREKFRQCLLNVMKNAIEAMPN----
pdb|3d36                              SSSSS         HHHHHHHHHHHHHHHHH
pdb|1byq         PMEEEEVETFAFQAEIAQLMSLIINTFYS-------NK-EIFLRELISNSSDALDKIRYE
pdb|1byq               SSSSS  HHHHHHHHHHHH               HHHHHHHHHHHHHHHHHHHH
pdb|2wi7         -----EVETFAFQAEIAQLMSLIINTFYS-------NK-EIFLRELISNSSDALDKIRYE
pdb|2wi7                SSSS  HHHHHHHHHHHH               HHHHHHHHHHHHHHHHHHHH
                      ...............:::::::::       :: :::::::::*:::*:::....

---------+---------+---------+---------+---------+---------+---------+
1234567890123456789012345678901234567890123456789012345678901234567890
         1         2         3         4         5         6         7
3. Multiple FASTA format (.fasta)
The standard FASTA multiple alignment format:
>pdb|3d36
--------------------VDIQATLAPFSVIGEREKFRQCLLNVMKNAIEAMPN----
------------GGTLQVYVSI---DNGRVLIRIADTGVGMTKEQLERLGEPYFTTKGVK
G---------------TGLGMMVVYRIIES-MNGTIRIESEIH-----------------
----------------KGTTVSIYLPLAS-------------------------------
-------------
>pdb|1z5a
----------KEKFTSLSPAEFFKRNPELAGFPNPARALYQTVRELIENSLDATDVHGI-
------------LPNIKITIDLIDDARQIYKVNVVDNGIGIPPQEVPNAFGRVLYSSKYV
NRQTR---------GMYGLGVKAAVLYSQMHQDKPIEIETSPVNSKRIYTFKLKIDINKN
EPIIVERGSVENTRGFHGTSVAISI--PGDWPKAKSRIYEYIKRTYIITPYAEFIFKDPE
GNVTYYPRLTNKI
>pdb|1byq
PMEEEEVETFAFQAEIAQLMSLIINTFYS-------NK-EIFLRELISNSSDALDKIRYE
TLTDPSKLDSGKELHINLIPNKQD-----RTLTIVDTGIGMTKADLINNLGTIAKSGTKA
FMEALQAGADISMIGQFGVGFYSAYLVA-----EKVTVITKHNDD-EQYAWESSAG----
--GSFTVRTDTGEPMGRGTKVILHLKEDQTEYLEERRIKEIVKKHSQFI-GYPITLFVE-
-------------
The key thing here is the format of the protein name line which must take one of the following forms:
>pdb|1z5awhere "A" is the chain identifier and "01" is the domain number.
>pdb|1z5aA
>pdb|1z5aA01