About Expression Atlas
What is Expression Atlas?
Expression Atlas is an open science resource that gives users a powerful way to find information about gene and protein expression. Our mission is to provide the scientific community with freely available information on the abundance and localisation of RNA (and proteins) across species and biological conditions such as different tissues, cell types, developmental stages and diseases among others.
Expression Atlas aims to help answering questions such as 'where is my favourite gene expressed?' or 'how its expression changes in a disease?'
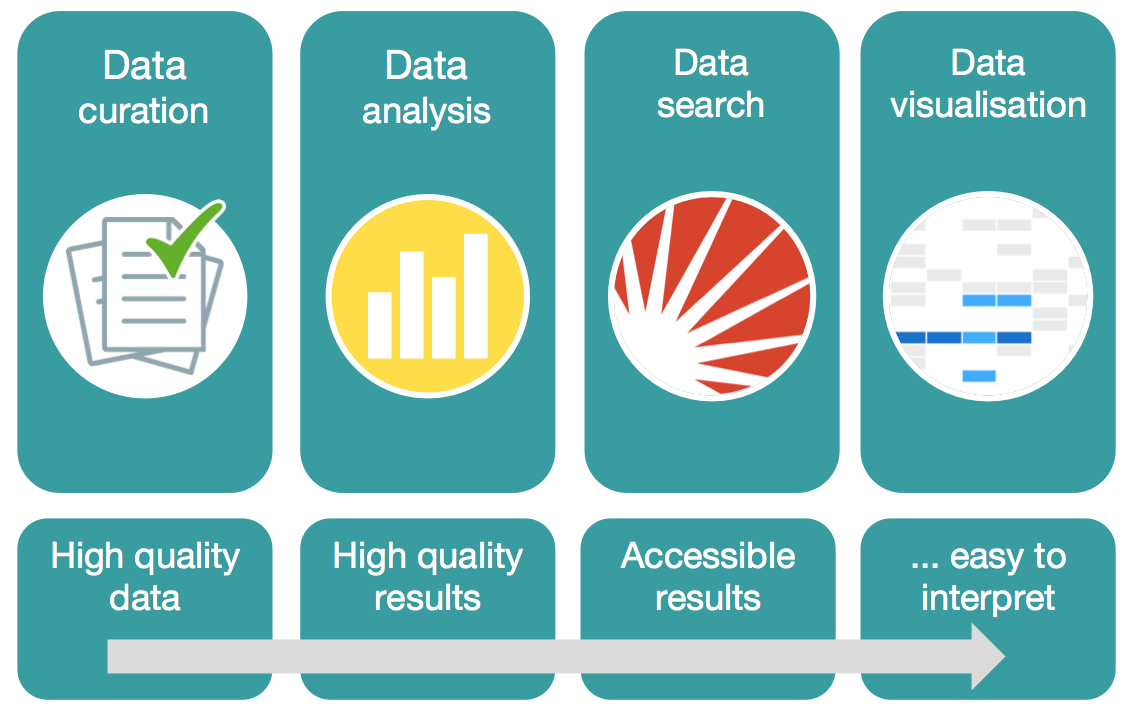
To achieve this objective, our project involves data curation, data analysis and the development of a web application to access and visualise publicly available data.

Access gene expression results from more than 3,000 experiments
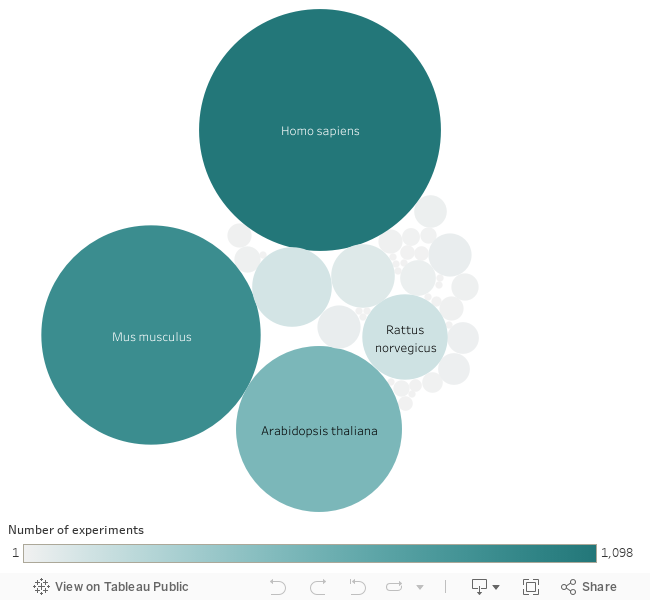
Expression Atlas provides gene expression results on more than 3,000 experiments from 40 different organisms, including metazoans and plants.
Although human experiments represent one third of Expression Atlas, we cover other animal species such as chicken, pig, cow or sheep.
Plant experiments represent one fourth of Expression Atlas with more than 700 experiments. Apart from Arabidopsis thaliana, that is the species more represented, Expression Atlas contains experiments from other 17 plant species such as rice, wheat, maize, tomato or potato.
All data are manually curated
Expression Atlas contains thousands of selected microarray and RNA-sequencing datasets that are manually curated by PhD biologists. Curation in Expression Atlas consists of a critical review of each dataset to provide a comprehensive representation of gene expression data.
We extract and structure information from the literature to accurately represent each experiment and to enrich the annotation of each sample. We add more metadata to samples to better describe both, biological and technical information.
All data are re-analysed using standardised methods
Expression Atlas has re-analysed more that 3,000 experiments, from which more than 500 are RNA-seq experiments. Microarray raw data are analysed using different packages from Bioconductor depending on the array platform used to perform the experiment.
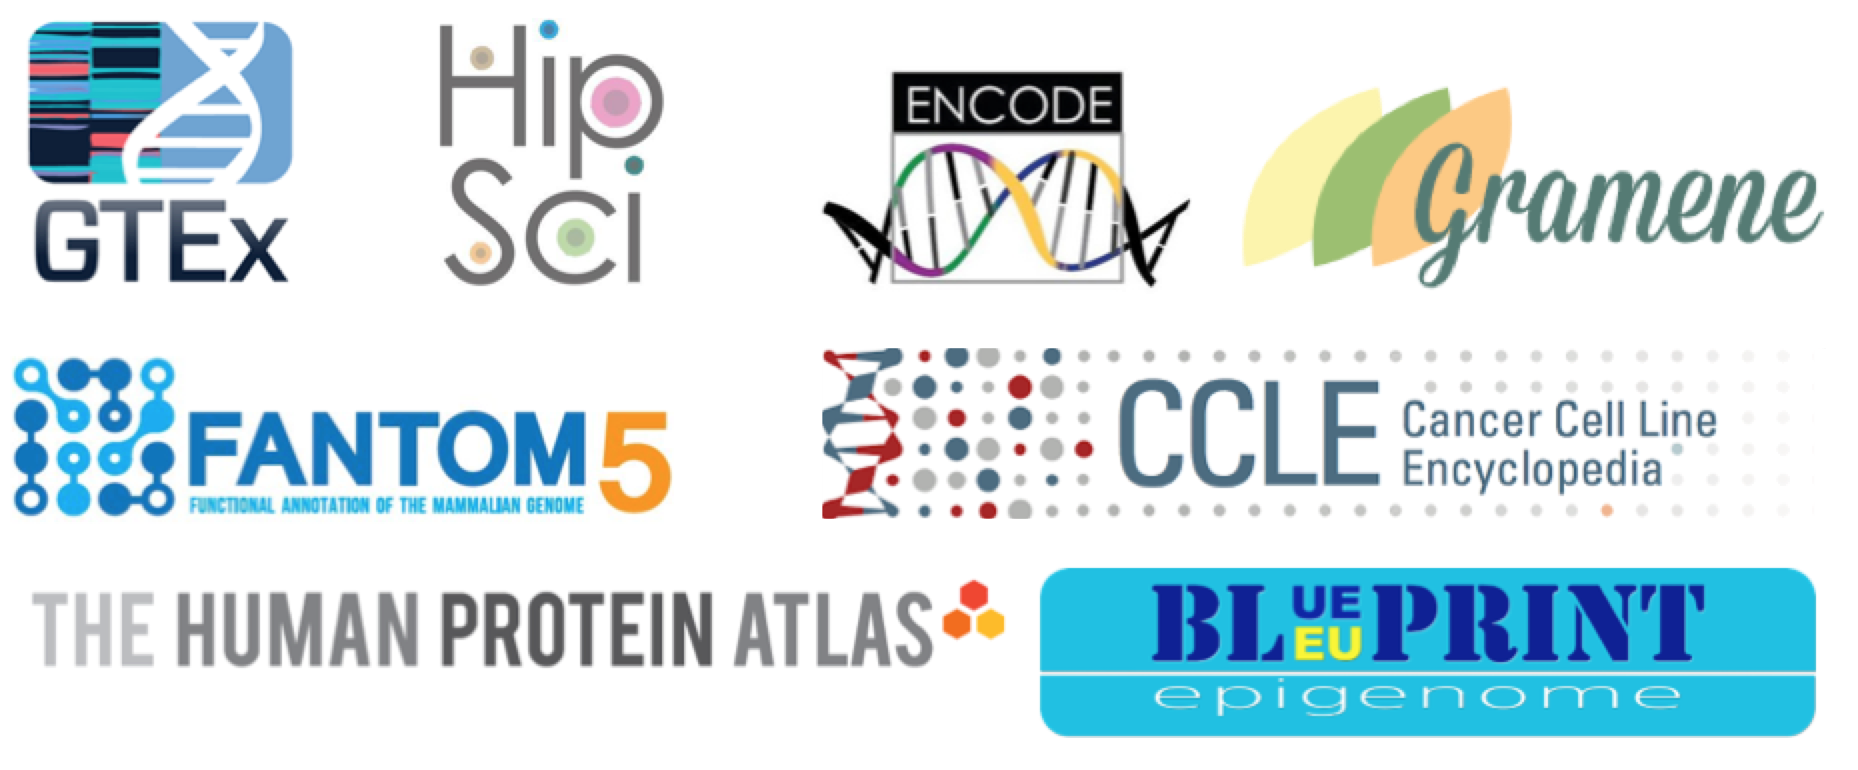
RNA-seq data are analysed using the iRAP pipeline. RNA-seq experiments in Expression Atlas include large landmark studies such as GTEx, CCLE, ENCODE or HipSci.
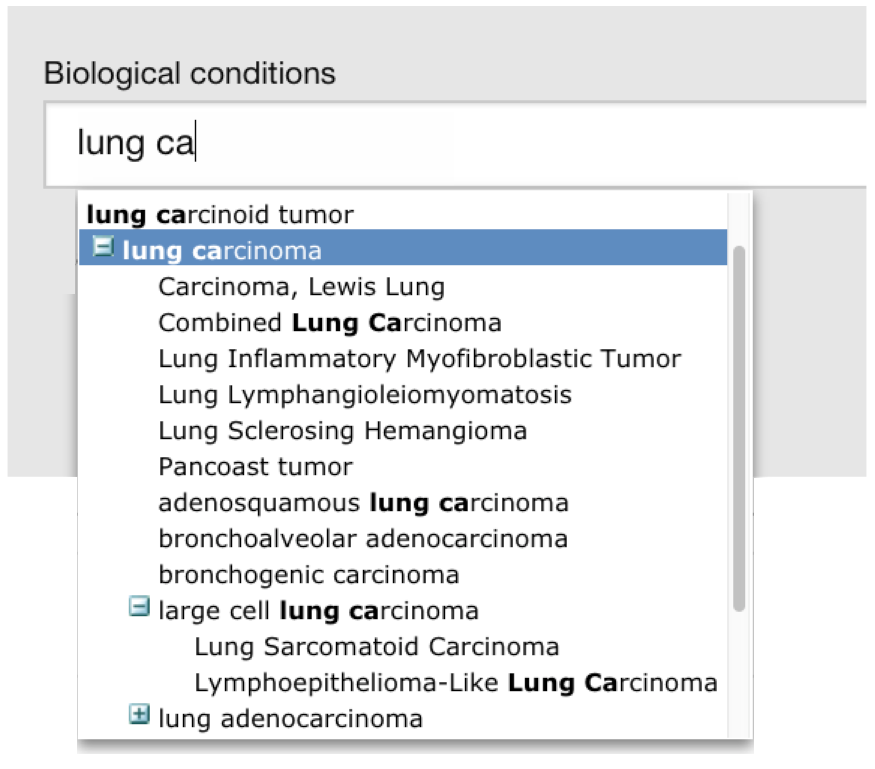
Efficient search via ontology-driven query expansion
The terms used to annotate samples are mapped to ontology terms from the Experimental Factor Ontology (EFO). Biocurators of Expression Atlas generate sets of ontology-mapping rules for Zooma, the annotation tool that we use to automatically generate the mappings.
Ontology mappings allow for much richer queries using the hierarchy within the ontology, for example, searching for lung carcinoma will return matches to the keyword and also results for different subtypes such as large cell lung carcinoma.
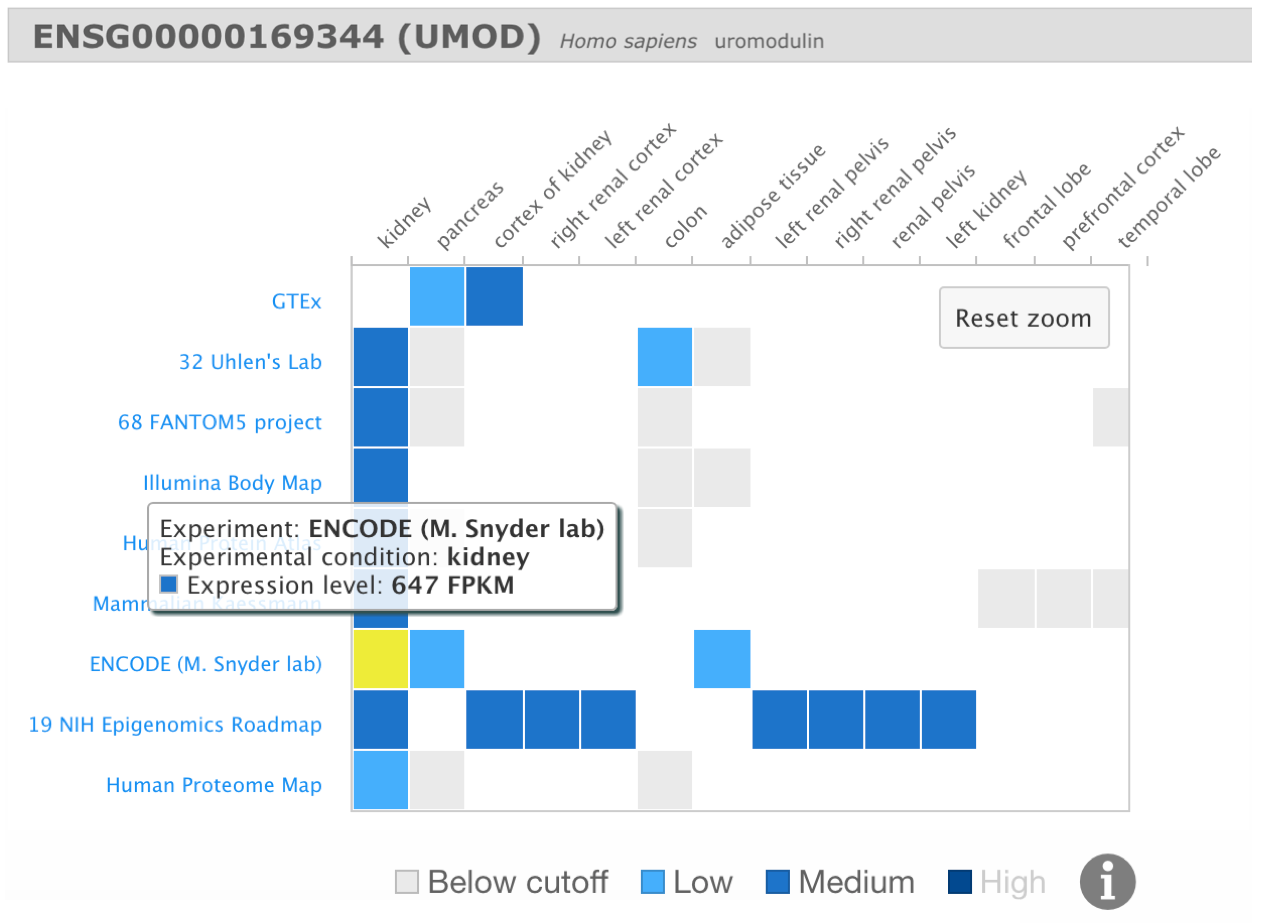
Easy interpretation of gene expression results through heatmap visualisation
Expression Atlas represents gene expression results using heatmaps. In a heatmap, gene expression values are converted into a colour-scale image, providing a visual representation of gene expression levels across different biological conditions.
In Expression Atlas we also generate heatmaps showing gene expression levels of a particular gene across different experiments and different biological conditions.