 |
PDBsum entry 2dv0

|
|
|
|
|
|

|

|

|

|
|

|
|

|
|

|
|

|
|

|
|

|
|
|
 |

|

|
|
|
|
|
|
|
|
|
|
|
|
|
|
|
|
|
|
|
|
|
|
|
|
|
|
|
|
|
|
|
|
|
|
|
Oxidoreductase
|
PDB id
|
|
|
|
2dv0
|
|
|
|
|
|
|
|
|
|
|
|
|
|
|

|

|

|
|
|
|
|
|
|
|
 |
Contents |
 |
|
|
|
|
|
|
|
|
|
|
|
|
* Residue conservation analysis
|
|
|
|
|
|
|
|
|
|
|
Enzyme class 1:
|
|
E.C.1.1.1.21
- aldose reductase.
|
|
|
|
|
|
|
Reaction:
|
|
|
1.
|
an alditol + NAD+ = an aldose + NADH + H+
|
|
2.
|
an alditol + NADP+ = an aldose + NADPH + H+
|
|
|
|
|
|
|
 alditol
|
+
|
NAD(+)
Bound ligand (Het Group name = )
matches with 91.67% similarity
|
=
|
 aldose
|
+
|
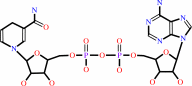 NADH
NADH
|
+
|
H(+)
|
|
|
|
|
|
|
alditol
|
+
|
NADP(+)
Bound ligand (Het Group name = )
corresponds exactly
|
=
|
aldose
|
+
|
 NADPH
NADPH
|
+
|
H(+)
|
|
|
|
|
|
|
|
|
|
Enzyme class 2:
|
|
E.C.1.1.1.300
- NADP-retinol dehydrogenase.
|
|
|
|
|
|
|
Reaction:
|
|
all-trans-retinol + NADP+ = all-trans-retinal + NADPH + H+
|
|
|
|
|
|
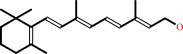 all-trans-retinol
|
+
|
NADP(+)
Bound ligand (Het Group name = )
corresponds exactly
|
=
|
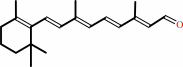 all-trans-retinal
|
+
|
NADPH
|
+
|
H(+)
|
|
|
|
|
|
|
|
|
|
Enzyme class 3:
|
|
E.C.1.1.1.372
- D/L-glyceraldehyde reductase.
|
|
|
|
|
|
|
Reaction:
|
|
|
1.
|
glycerol + NADP+ = L-glyceraldehyde + NADPH + H+
|
|
2.
|
glycerol + NADP+ = D-glyceraldehyde + NADPH + H+
|
|
|
|
|
|
|
 glycerol
|
+
|
NADP(+)
Bound ligand (Het Group name = )
corresponds exactly
|
=
|
 L-glyceraldehyde
|
+
|
NADPH
|
+
|
H(+)
|
|
|
|
|
|
|
glycerol
|
+
|
NADP(+)
Bound ligand (Het Group name = )
corresponds exactly
|
=
|
 D-glyceraldehyde
|
+
|
NADPH
|
+
|
H(+)
|
|
|
|
|
|
|
|
|
|
Enzyme class 4:
|
|
E.C.1.1.1.54
- allyl-alcohol dehydrogenase.
|
|
|
|
|
|
|
Reaction:
|
|
allyl alcohol + NADP+ = acrolein + NADPH + H+
|
|
|
|
|
|
 allyl alcohol
|
+
|
NADP(+)
Bound ligand (Het Group name = )
corresponds exactly
|
=
|
 acrolein
|
+
|
NADPH
|
+
|
H(+)
|
|
|
|
|
|
|
|
|
|
|
|
|
Note, where more than one E.C. class is given (as above), each may
correspond to a different protein domain or, in the case of polyprotein
precursors, to a different mature protein.
|
|
|
|
Molecule diagrams generated from .mol files obtained from the
KEGG ftp site
|
|
|
|
|
|
|
|
|
|
|
|
|
|
 |
|
|
|
|
|
|
| |
|
|
| |
|
DOI no:
|
J Mol Biol
363:174-187
(2006)
|
|
PubMed id:
|
|
|
|
|
|
| |
|
Expect the unexpected or caveat for drug designers: multiple structure determinations using aldose reductase crystals treated under varying soaking and co-crystallisation conditions.
|
|
H.Steuber,
M.Zentgraf,
C.Gerlach,
C.A.Sotriffer,
A.Heine,
G.Klebe.
|
|
|
|
|
| |
ABSTRACT
|
|
|
|
| |
|
|
In structure-based drug design, accurate crystal structure determination of
protein-ligand complexes is of utmost importance in order to elucidate the
binding characteristics of a putative lead to a given target. It is the starting
point for further design hypotheses to predict novel leads with improved
properties. Often, crystal structure determination is regarded as ultimate proof
for ligand binding providing detailed insight into the specific binding mode of
the ligand to the protein. This widely accepted practise relies on the
assumption that the crystal structure of a given protein-ligand complex is
unique and independent of the protocol applied to produce the crystals. We
present two examples indicating that this assumption is not generally given,
even though the composition of the mother liquid for crystallisation was kept
unchanged: Multiple crystal structure determinations of aldose reductase
complexes obtained under varying crystallisation protocols concerning soaking
and crystallisation exposure times were performed resulting in a total of 17
complete data sets and ten refined crystal structures, eight in complex with
zopolrestat and two complexed with tolrestat. In the first example, a flip of a
peptide bond is observed, obviously depending on the crystallisation protocol
with respect to soaking and co-crystallisation conditions. This peptide flip is
accompanied by a rupture of an H-bond formed to the bound ligand zopolrestat.
The indicated enhanced local mobility of the complex is in agreement with the
results of molecular dynamics simulations. As a second example, the aldose
reductase-tolrestat complex is studied. Unexpectedly, two structures could be
obtained: one with one, and a second with four inhibitor molecules bound to the
protein. They are located in and near the binding pocket facilitated by crystal
packing effects. Accommodation of the four ligand molecules is accompanied by
pronounced shifts concerning two helices interacting with the additional ligands.
|
|
|
|
|
|
| |
Selected figure(s)
|
|
|
|
| |
|
|

|
|

|
|
Figure 3.
Figure 3. Selected conformational snapshots obtained from
the MD simulation of the ALR2–zopolrestat complex are
represented for the residues Cys298, Ala299, and Leu300. These
snapshots suggest enhanced mobility in this region: while the
conformations shown in green or magenta enable H-bond formation
to the ligand's N3, this H-bond is ruptured in the conformations
coloured in light blue or yellow. The inhibitor as observed in
10days_cocryst is represented as grey sticks after superimposing
this crystal structure with the MD snapshots using a C^α-fit.
|
|
Figure 6.
Figure 6. TIM-barrel of ALR2 represented as a tube,
emphasizing the local mobility with respect to the refined
B-factors. The tube is coloured by B-factor: blue regions
correspond to low temperature factors, whereas green, yellow and
red colour characterize regions of subsequently increasing
B-factor. In particular, dark blue represents B-values in the
single-digit range, whereas red depicts regions with average
B-factors of 40 Å^2 and higher. Additionally, gain of
temperature factor is represented by an increasing diameter of
the tube. The inhibitor zopolrestat is shown in magenta: (a)
represents the corresponding tube representation for
10days_cocryst, in (b) the one for 6days_soaked_1 is given. Note
the remarkable gain of local mobility within the C-terminal loop
region lining the ligand binding pocket observed in
6days_soaked_1 (  vert,
similar 31 Å^2, shown in yellow) compared to
10days_cocryst ( vert,
similar 15 Å^2, represented in light blue). This
comparison suggests that extended soaking exposure times provoke
increasing mobility with respect to distinct regions represented
by higher B-factors. vert,
similar 31 Å^2, shown in yellow) compared to
10days_cocryst ( vert,
similar 15 Å^2, represented in light blue). This
comparison suggests that extended soaking exposure times provoke
increasing mobility with respect to distinct regions represented
by higher B-factors.
|
|
|
|
|
|
| |
The above figures are
reprinted
by permission from Elsevier:
J Mol Biol
(2006,
363,
174-187)
copyright 2006.
|
|
| |
Figures were
selected
by the author.
|
|
|
|
|
|
|
|
|
|
|
|
|
|
|
|
 |
 |
 |
|
Literature references that cite this PDB file's key reference
|
|
|
| |
PubMed id
|
|
Reference
|
|
|
|
|
|
L.Chen,
J.Wang,
Y.Y.Zhang,
S.F.Yan,
D.Neumann,
U.Schlattner,
Z.X.Wang,
and
J.W.Wu
(2012).
AMP-activated protein kinase undergoes nucleotide-dependent conformational changes.
|
| |
Nat Struct Mol Biol,
19,
716-718.
|
|
|
PDB codes:
|
|
|
|
|
|
|
|
A.H.Al-Nadaf,
and
M.O.Taha
(2011).
Discovery of new renin inhibitory leads via sequential pharmacophore modeling, QSAR analysis, in silico screening and in vitro evaluation.
|
| |
J Mol Graph Model,
29,
843-864.
|
|
|
|
|
|
|
B.O.Al-Najjar,
H.A.Wahab,
T.S.Tengku Muhammad,
A.C.Shu-Chien,
N.A.Ahmad Noruddin,
and
M.O.Taha
(2011).
Discovery of new nanomolar peroxisome proliferator-activated receptor γ activators via elaborate ligand-based modeling.
|
| |
Eur J Med Chem,
46,
2513-2529.
|
|
|
|
|
|
|
C.Mulakala,
and
Y.N.Kaznessis
(2009).
Path-integral method for predicting relative binding affinities of protein-ligand complexes.
|
| |
J Am Chem Soc,
131,
4521-4528.
|
|
|
|
|
|
|
I.M.Kapetanovic
(2008).
Computer-aided drug discovery and development (CADDD): in silico-chemico-biological approach.
|
| |
Chem Biol Interact,
171,
165-176.
|
|
|
|
|
|
|
P.Cozzini,
G.E.Kellogg,
F.Spyrakis,
D.J.Abraham,
G.Costantino,
A.Emerson,
F.Fanelli,
H.Gohlke,
L.A.Kuhn,
G.M.Morris,
M.Orozco,
T.A.Pertinhez,
M.Rizzi,
and
C.A.Sotriffer
(2008).
Target flexibility: an emerging consideration in drug discovery and design.
|
| |
J Med Chem,
51,
6237-6255.
|
|
|
|
|
|
|
C.B.Aakeröy,
J.Desper,
and
M.M.Smith
(2007).
Constructing, deconstructing, and reconstructing ternary supermolecules.
|
| |
Chem Commun (Camb),
(),
3936-3938.
|
|
|
|
|
|
|
O.Gallego,
F.X.Ruiz,
A.Ardèvol,
M.Domínguez,
R.Alvarez,
A.R.de Lera,
C.Rovira,
J.Farrés,
I.Fita,
and
X.Parés
(2007).
Structural basis for the high all-trans-retinaldehyde reductase activity of the tumor marker AKR1B10.
|
| |
Proc Natl Acad Sci U S A,
104,
20764-20769.
|
|
|
PDB code:
|
|
|
|
|
|
|
The most recent references are shown first.
Citation data come partly from CiteXplore and partly
from an automated harvesting procedure. Note that this is likely to be
only a partial list as not all journals are covered by
either method. However, we are continually building up the citation data
so more and more references will be included with time.
Where a reference describes a PDB structure, the PDB
codes are
shown on the right.
|
|


 Links
Links


