- Course overview
- Search within this course
- What information does a PDB entry contain?
- How is the information structured?
- Downloading data from a PDB entry page
- Summary
- Learn more
- Get help and support on PDBe
- Your feedback
![]()
All materials are free cultural works licensed under a Creative Commons Attribution 4.0 International (CC BY 4.0) license, except where further licensing details are provided.
Domains
The domain fields are integrated data from four different resources:
- CATH (structure based: domain defined by 3D structural organisation of proteins). A domain is defined according to hierarchical structural organization derived from 3D geometry.
- SCOP (structure based); a domain is classified based on evolutionary and structural relationships in 3D protein structures.
- InterPro (sequence based: domain identified by conserved sequence pattern or profile). A domain is identified by integrating multiple sequence-based signatures from different databases.
- Pfam (hosted by InterPro, sequence based). A domain is mapped against the primary sequence of the protein present in the entry.
Accessions from these resources (e.g., IPR012674 from InterPro, 2.40.128.20 from SCOP, or PF00001 from Pfam) are then aligned to protein residues using the SIFTS (Structure Integration with Function, Taxonomy and Sequence) resource.
Where to find it
All domain data integrated into an entry page can be accessed programmatically via the following PDBe API endpoints:
- https://www.ebi.ac.uk/pdbe/api/v2/mappings/interpro/pdb_id
- https://www.ebi.ac.uk/pdbe/api/v2/mappings/pfam/pdb_id
- https://www.ebi.ac.uk/pdbe/api/v2/mappings/cath/pdb_id
- https://www.ebi.ac.uk/pdbe/api/v2/mappings/scop/pdb_id
- https://www.ebi.ac.uk/pdbe/api/v2/mappings/scop2/pdb_id
Please see this training course for more details: https://www.ebi.ac.uk/training/events/introduction-pdbe-programmatic-access/
These endpoints provide the same underlying data, which can also be visualised interactively through the different tabs, as shown below.

In the Summary tab, you can use the dropdown menu to quickly view the domains associated with the entry. By clicking on or hovering over a domain, the corresponding region of the protein is highlighted in the 3D viewer. This interactive highlighting is also available in the Macromolecules and Domains tabs.
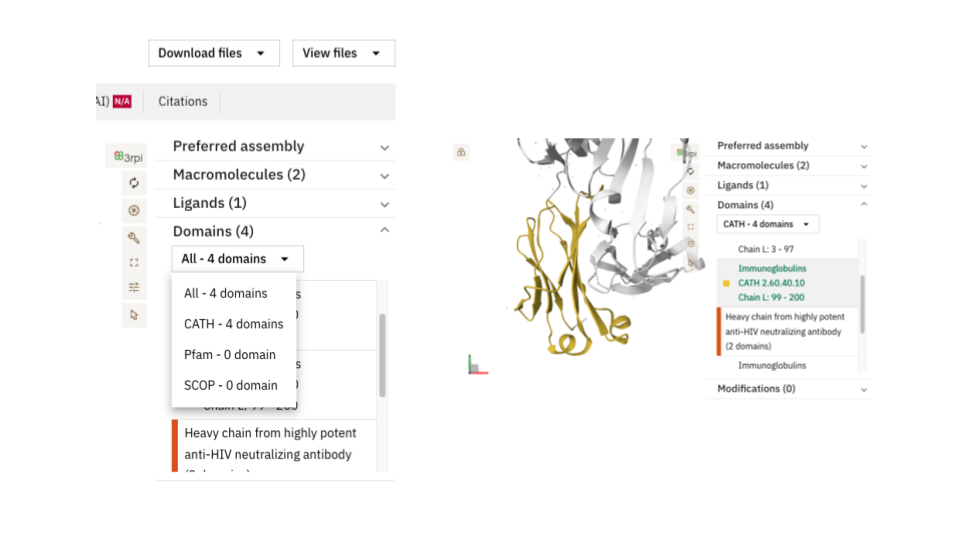
In the Macromolecules tab, domains can be visualised by chain in the 1D layout, as illustrated below. All domain annotations can be highlighted on both the 3D and 2D viewers. The 2D topology diagram allows you to highlight domains present in a protein chain by selecting the desired resource from the dropdown menu. Clicking on a domain in the 1D layout will simultaneously highlight the corresponding domain in both the 2D and 3D views.
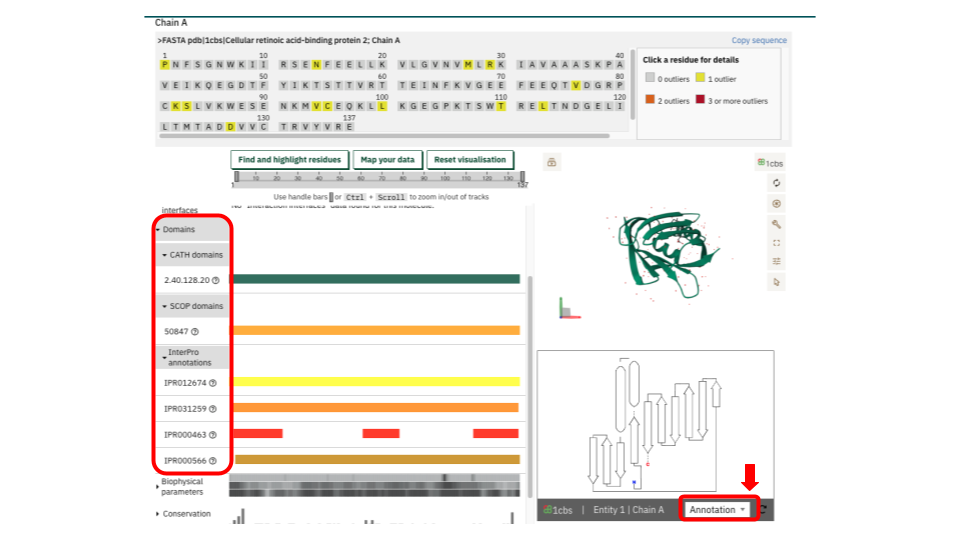
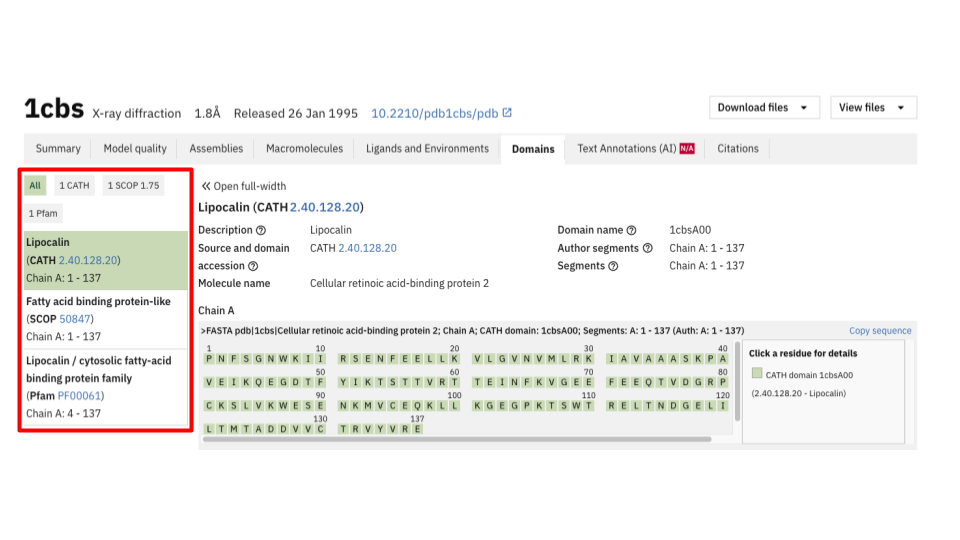
In the Domains tab, you can access a detailed view of all domain types associated with a specific entry chain. After selecting the chain and, if available, the integrated resource (some entries may only include CATH, for example), the 1D layout viewer displays the domain accessions linked to that chain. You can highlight the corresponding regions on the 3D viewer. Additionally, the “Find and Highlight residues” and “Map your data” buttons allow you to focus on specific residues, providing a detailed view of your regions of interest. It is important to note