- Course overview
- Search within this course
- Network analysis in biology
- Types of biological networks
- The sources of data underlying biological networks
- Protein-protein interaction networks
- Building and analysing PPINs
- Summary
- Quiz: Check your learning
- Your feedback
- Learn more
- References
![]()
All materials are free cultural works licensed under a Creative Commons Attribution 4.0 International (CC BY 4.0) license, except where further licensing details are provided.
Graph theory: adjacency matrices
Every network can be expressed mathematically in the form of an adjacency matrix (Figure 4). In these matrices the rows and columns are assigned to the nodes in the network and the presence of an edge is symbolised by a numerical value. By using the matrix representation of the network we can calculate network properties such as degree, and other centralities by applying basic concepts from linear algebra (see later in the course).
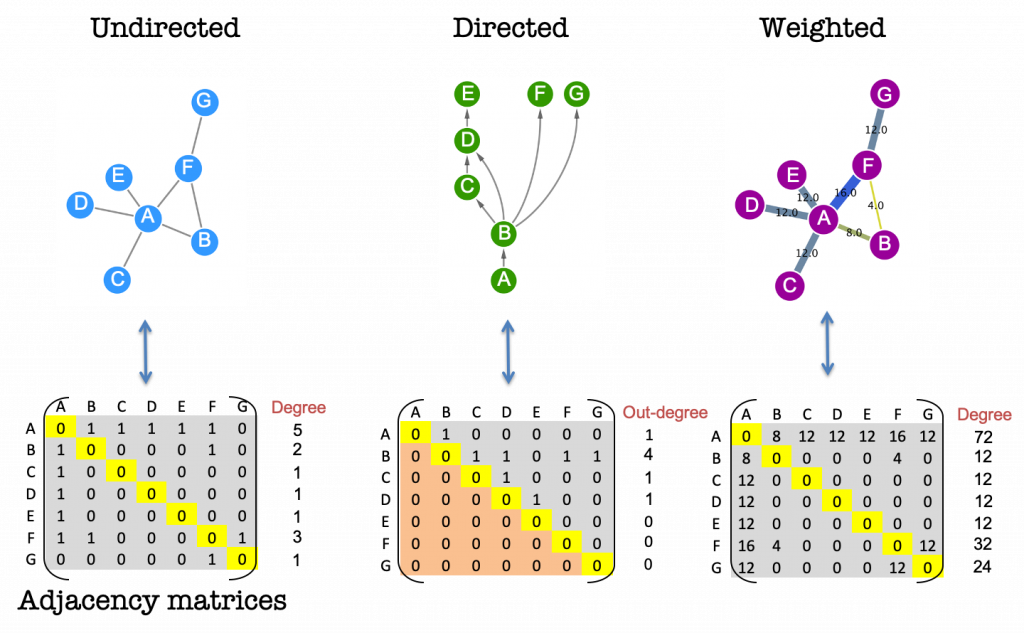
A network with undirected, unweighted edges will be represented by a symmetric matrix containing only the values 1 and 0 to represent the presence and absence of connections, respectively.
Directed and weighted networks can make use of different numerical values in the matrix to express these more complex relationships. The sign of the values, for example, is sometimes used to indicate stimulation or inhibition.