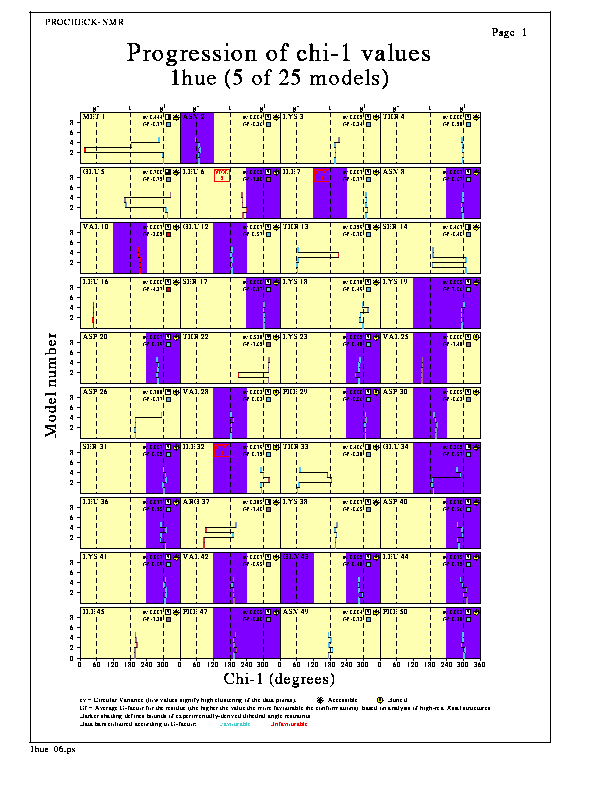
Progression of chi1 values


This plot shows how the chi-1 values progress from model to model in the ensemble (starting with Model 1 at the bottom of each graph).
The colours of the bars vary according to how favourable (blue) or unfavourable (red) the chi-1 values are for the given residue type.
This plot can help identify in which models the values may be unusual.
Similar plots will be generated for the phi, psi and chi-2 angles when the appropriate parameter is set.