You can now superpose AlphaFold models onto PDB structures at the touch of a button thanks to improvements to our structure superposition process at the PDBe-KB aggregated views of proteins.
We recently announced a structure superposition process available through the PDBe-KB aggregated views of proteins. This process takes all the structures in the PDB for a specific protein, based on UniProt accession, and groups these structures into clusters, highlighting the different conformational states for each protein segment.
We have now expanded this process to superpose the corresponding predicted model from the AlphaFold Protein Structure Database (AlphaFold DB). This new feature loads the model from AlphaFold DB on demand and superposes it onto the equivalent PDB structures, using the Mol* molecular viewer. This allows easy comparison of the experimental structures in the PDB with the predicted models in AlphaFold DB, to identify whether the predicted model matches a specific conformational state of the protein.
You can view the structure superposition for a specific protein (per UniProt accession) at the PDBe-KB aggregated views of proteins. The superposition can be accessed from the Summary or Structures tabs using the green buttons labelled ‘3D view of superposed structures’. This opens the structure superposition window, with representative conformational states for that protein superimposed. The right hand menu gives an option ‘load AlphaFold structure’, which loads the AlphaFold DB model for this UniProt accession and displays it in the viewer.

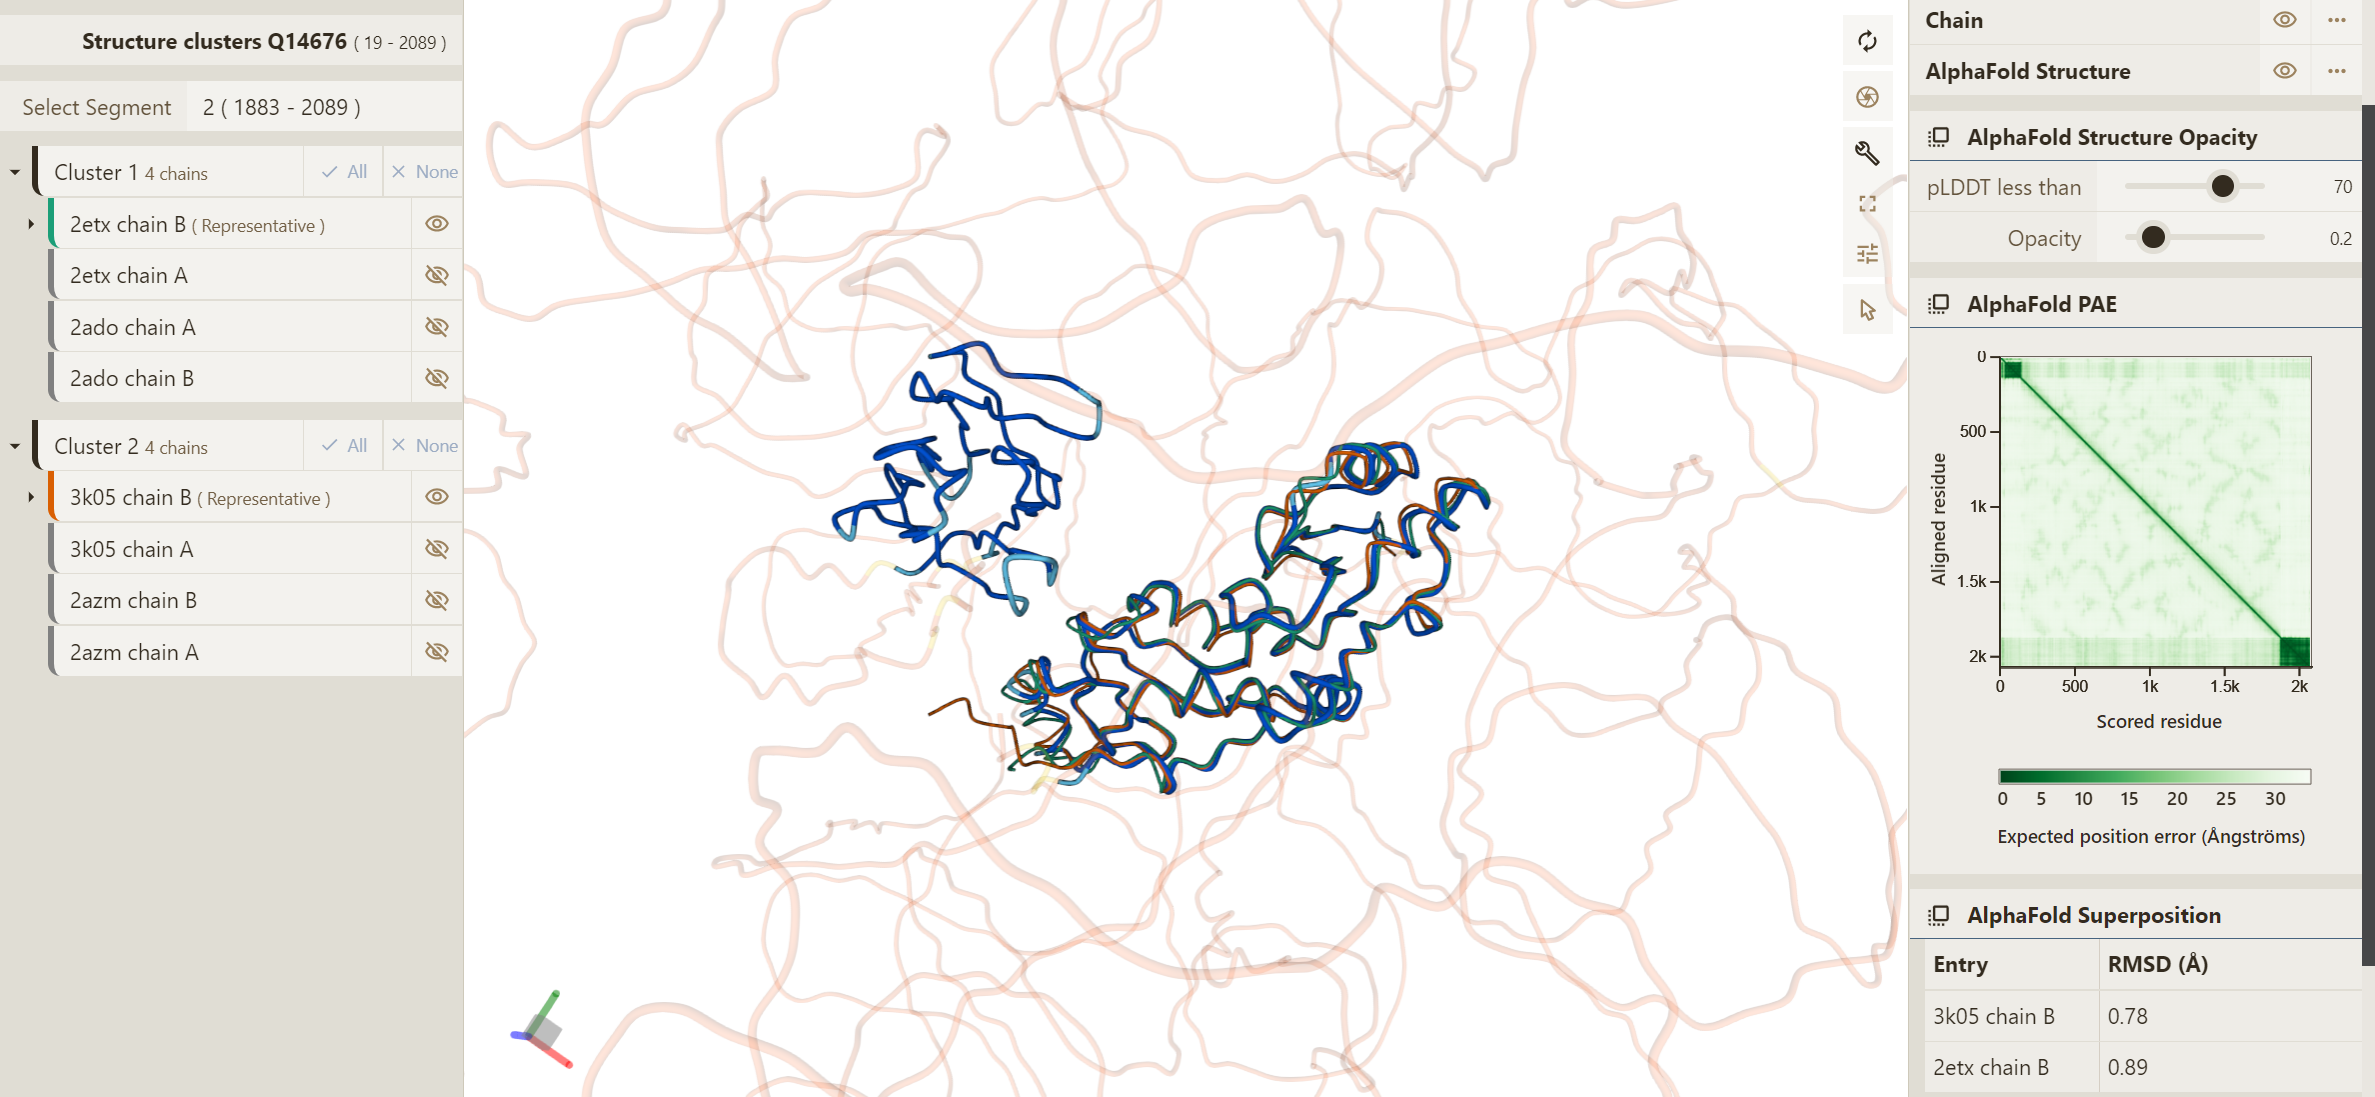
The AlphaFold model is displayed in ribbon format and coloured based on the pLDDT score, the per-residue confidence measure in the model prediction. By default, regions with a pLDDT score of lower than 70 are displayed at low opacity, to indicate the reduced confidence of these regions. Also displayed on the right hand menu is the RMSD (Root mean square deviation) between the AlphaFold model and the best representative structure from each conformational state. This gives an indication of the similarity of the AlphaFold structure to the conformational states available in the PDB.
Also displayed on the menu is the AlphaFold PAE plot, which gives an indication of the reliability of orientation of different parts of the structure relative to each other. The example below shows the superposition of the AlphaFold DB model for Human MDC1 onto PDB entries of segment 2 (UniProt residue range 1883-2089). This AlphaFold DB model contains two high-confidence regions with pLDDT scores above 70, however the remainder is low confidence, displayed as unstructured. Despite these confident regions being shown close together in the model, the PAE plot displays no correlation between these two regions of the sequence. This, therefore, indicates that the relative positions of these regions are not necessarily accurate and should not be interpreted as such.
Another example (shown below) is Calpain-2 from Rat where we have two distinct, biologically relevant conformations: One is inactive (in absence of calcium ions) and the other is the active form (with calcium ions bound). With the AlphaFold DB superimposed, we can see that the predicted model overlays better with the inactive conformation (representative PDB entry 1df0, chain A), with an RMSD of 2.84 Å compared with 4.97 Å for the active conformation (representative PDB entry 3df0, chain A).

We encourage you to try out this feature with your own protein of interest - let us know if the right conformational states are identified and which one is predicted by AlphaFold. You can use the ‘feedback’ form on the relevant PDBe-KB page to contact our team directly with any feedback.