 |
PDBsum entry 2b8k

|
|
|
|
|
 |
Contents |
 |
|
|
|
|
|
|
|
|
|
|
|
 1416 a.a.
|
|
|
|
|
|
|
|
|
|
|
 1114 a.a.
|
|
|
|
|
|
|
|
|
|
|
 266 a.a.
|
|
|
|
|
|
|
|
|
|
|
 182 a.a.
|
|
|
|
|
|
|
|
|
|
|
 214 a.a.
|
|
|
|
|
|
|
|
|
|
|
 84 a.a.
|
|
|
|
|
|
|
|
|
|
|
 171 a.a.
|
|
|
|
|
|
|
|
|
|
|
 133 a.a.
|
|
|
|
|
|
|
|
|
|
|
 119 a.a.
|
|
|
|
|
|
|
|
|
|
|
 65 a.a.
|
|
|
|
|
|
|
|
|
|
|
 115 a.a.
|
|
|
|
|
|
|
|
|
|
|
 46 a.a.
|
|
|
|
|
|
|
|
|
* Residue conservation analysis
|
|
|
|
|
|
PDB id:
|
|
|
|
| Name: |
|
Transferase
|
|
|
Title:
|
|
12-subunit RNA polymerase ii
|
|
Structure:
|
|
DNA-directed RNA polymerase ii largest subunit. Chain: a. Synonym: RNA polymerase ii subunit 1, b220. DNA-directed RNA polymerase ii 140 kda polypeptide. Chain: b. Synonym: b150, RNA polymerase ii subunit 2. DNA-directed RNA polymerase ii 45 kda polypeptide. Chain: c. Synonym: b44.5.
|
|
Source:
|
|
Saccharomyces cerevisiae. Baker's yeast. Organism_taxid: 4932. Organism_taxid: 4932
|
|
Biol. unit:
|
|
Dodecamer (from
)
|
|
Resolution:
|
|
|
|
Authors:
|
|
P.A.Meyer,P.Ye,M.Zhang,M.H.Suh,J.Fu
|
Key ref:

|
|
P.A.Meyer
et al.
(2006).
Phasing RNA polymerase II using intrinsically bound Zn atoms: an updated structural model.
Structure,
14,
973-982.
PubMed id:
DOI:

|
|
|
Date:
|
|
|
07-Oct-05
|
Release date:
|
20-Jun-06
|
|
|
|
|
|
|
PROCHECK
|

|
|
|
|
|
Headers
|
|
|
|
References
|
|
|
|
|
|

|
|
P04050
(RPB1_YEAST) -
DNA-directed RNA polymerase II subunit RPB1 from Saccharomyces cerevisiae (strain ATCC 204508 / S288c)
|
|
|
|
Seq:
Struc:
|
|
|
|
1733 a.a.
1416 a.a.
|
|

|

|
|
|
|
|
|
|
|
|
|
|
|
|

|
|
P08518
(RPB2_YEAST) -
DNA-directed RNA polymerase II subunit RPB2 from Saccharomyces cerevisiae (strain ATCC 204508 / S288c)
|
|
|
|
Seq:
Struc:
|
|
|
|
1224 a.a.
1114 a.a.
|
|
|

|
|
|
|
|
|
|
|
|
|
|
|
|

|
|
P16370
(RPB3_YEAST) -
DNA-directed RNA polymerase II subunit RPB3 from Saccharomyces cerevisiae (strain ATCC 204508 / S288c)
|
|
|
|
Seq:
Struc:
|
|
|
|
318 a.a.
266 a.a.
|
|
|

|

|
|
|
|
|
|
|
|
|
|
|
|

|
|
P20433
(RPB4_YEAST) -
DNA-directed RNA polymerase II subunit RPB4 from Saccharomyces cerevisiae (strain ATCC 204508 / S288c)
|
|
|
|
Seq:
Struc:
|
|
|
|
221 a.a.
182 a.a.
|
|
|

|
|
|
|
|
|
|
|
|
|
|
|
|

|
|
P20434
(RPAB1_YEAST) -
DNA-directed RNA polymerases I, II, and III subunit RPABC1 from Saccharomyces cerevisiae (strain ATCC 204508 / S288c)
|
|
|
|
Seq:
Struc:
|
|
|
|
215 a.a.
214 a.a.
|
|
|

|
|
|
|
|
|
|
|
|
|
|
|
|

|
|
P20435
(RPAB2_YEAST) -
DNA-directed RNA polymerases I, II, and III subunit RPABC2 from Saccharomyces cerevisiae (strain ATCC 204508 / S288c)
|
|
|
|
Seq:
Struc:
|
|
|
|
155 a.a.
84 a.a.
|
|
|

|
|
|
|
|
|
|
|
|
|
|
|
|

|
|
P34087
(RPB7_YEAST) -
DNA-directed RNA polymerase II subunit RPB7 from Saccharomyces cerevisiae (strain ATCC 204508 / S288c)
|
|
|
|
Seq:
Struc:
|
|
|
|
171 a.a.
171 a.a.
|
|
|

|
|
|
|
|
|
|
|
|
|
|
|
|

|
|
P20436
(RPAB3_YEAST) -
DNA-directed RNA polymerases I, II, and III subunit RPABC3 from Saccharomyces cerevisiae (strain ATCC 204508 / S288c)
|
|
|
|
Seq:
Struc:
|
|
|
|
146 a.a.
133 a.a.
|
|
|

|
|
|
|
|
|
|
|
|
|
|
|
|

|
|
P27999
(RPB9_YEAST) -
DNA-directed RNA polymerase II subunit RPB9 from Saccharomyces cerevisiae (strain ATCC 204508 / S288c)
|
|
|
|
Seq:
Struc:
|
|
|
|
122 a.a.
119 a.a.
|
|
|

|
|
|
|
|
|
|
|
|
|
|
|
|

|
|
P22139
(RPAB5_YEAST) -
DNA-directed RNA polymerases I, II, and III subunit RPABC5 from Saccharomyces cerevisiae (strain ATCC 204508 / S288c)
|
|
|
|
Seq:
Struc:
|
|
|
|
70 a.a.
65 a.a.
|
|
|

|
|
|
|
|
|
|
|
|
|
|
|
|
|
|
|
|
|
Enzyme class:
|
|
Chains A, B, C, D, E, F, G, H, I, J, K, L:
E.C.2.7.7.6
- DNA-directed Rna polymerase.
|
|
|
|
|
|
|
Reaction:
|
|
RNA(n) + a ribonucleoside 5'-triphosphate = RNA(n+1) + diphosphate
|
|
|
|
|
|
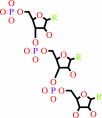 RNA(n)
|
+
|
ribonucleoside 5'-triphosphate
|
=
|
RNA(n+1)
|
+
|
 diphosphate
|
|
|
|
|
|
|
|
|
|
|
|
|
Molecule diagrams generated from .mol files obtained from the
KEGG ftp site
|
|
|
|
|
|
|
|
|
|
|
|
|
|
 |
|
|
|
|
|
|
| |
|
|
| |
|
DOI no:
|
Structure
14:973-982
(2006)
|
|
PubMed id:
|
|
|
|
|
|
| |
|
Phasing RNA polymerase II using intrinsically bound Zn atoms: an updated structural model.
|
|
P.A.Meyer,
P.Ye,
M.Zhang,
M.H.Suh,
J.Fu.
|
|
|
|
|
| |
ABSTRACT
|
|
|
|
| |
|
|
Macromolecular assemblies as large as RNA polymerase II (Pol II) can be phased
by a few intrinsically bound Zn atoms, by using MAD experiments as described
here. A phasing effectiveness of 570 aa/Zn is attained for Pol II. The resulting
experimental, unbiased electron density map is of such quality that it confirms
the existing crystallographic model and further reveals structural regions not
shown by model phases, thus updating the Pol II model at three sites. The
mechanistically important fork loop-1 element is observed to be ordered in the
absence of nucleic acids, suggesting additional insights into the mechanisms
that maintain the stability of the transcription ternary complex and allow its
release. Furthermore, a computational experiment with simulated MAD data sets
demonstrates that 1 Zn site is able to provide adequate experimental phase
information for as many as 1100 amino acids of polypeptide, under the conditions
of the current synchrotron and detector technologies.
|
|
|
|
|
|
| |
Selected figure(s)
|
|
|
|
| |
|
|

|
|

|
|
Figure 1.
Figure 1. Calculating an Experimental Electron Density Map of
Pol II by using Zn-MAD
(A) A representative anomalous
difference Fourier map (7.2 Å) based on a set of Zn peak
data and the model phases. Density contours are displayed at the
3.0σ (standard deviation) level in red. Three of the eight Zn
sites are shown as green spheres.
(B) A representative
dispersive difference Fourier map (7.2 Å) based on a set
of dispersive data and the model phases. The same map parameters
as in (A) were used in the calculation. The color scheme remains
the same as in (A).
(C) A representative crosscrystal
dispersive difference Fourier map (7.2 Å) used to assess
crystal isomorphism. The map was calculated by using the model
phases and amplitude differences between the remote data of
crystal-1 and the inflection data of crystal-2. The map
parameters and color scheme are the same as in (B).
(D–I)
(D) An experimental map based solely on Zn anomalous peak data
(SAS) and the known coordinates of the Zn sites. The map was
calculated to 7.2 Å and is shown in red at 1.0σ. An
existing 12 subunit Pol II model (Cα only) is shown in blue.
The green wire model is a lattice-packing neighbor. The
heterodimer of Rpb4/7 (indicated by “Rpb4/7”) protrudes to
the right from the bottom of the clamp domain (indicated by
“Clamp”). All of the maps in (D)–(I) were solvent
flattened as described in Experimental Procedures. Map slab
thickness, box sizes, and the color scheme are the same in
(D)–(I). (E) An experimental map calculated from a Zn
dispersive data set, treated as SIR. The resolution cutoff is
the same as in (D). (F) A Zn-MAD map (7.2 Å) resulted from
combining the anomalous and dispersive information. Lattice
contacts (indicated by “Contacts”) clarify in the full MAD
map, as indicated by the arrow. (G) The Zn-MAD map (7.2 Å)
produced from combining multiple Zn-MAD phasing sets. The Rpb8
β sheet (indicated by “Rpb8”) is labeled. (H) The Zn-MAD
map resulting from the manually edited mask (for solvent
flattening). The polymerase active site is indicated by the
arrow. (I) The final Zn-MAD map calculated to 4.1 Å. The
map was computed with smaller grid spacing than the
low-resolution maps described in other panels; thus, it appears
more crowded. Significantly more details of the polypeptide
chains become visible in this map. The arrow indicates the
density for fork loop-1 that was disordered in previous
uncomplexed Pol II structures.
|
|
Figure 2.
Figure 2. Updating the Pol II Model According to the Zn-MAD
Densities
(A–C) (A) Definition of the loop structure at
the tip of a two-helix stalk in Rpb2. Poly-alanines (green, Cα
only) were fitted into the density, connecting the helices.
Electron densities (red) are shown all at 1.0σ level for
(A)–(C). The existing model of Pol II (Cα only) is colored
blue in (A)–(C). Some of the side chain densities that
projected off the α carbons were evident in the 4.1 Å
Zn-MAD map. (B) The model for Rpb4 was updated according to the
Zn-MAD densities. Residues 118–126 were adjusted to fit the
density. Residues 113–117 were inserted according to the
density. α carbons of the updated residues are shown in green.
Again, partial densities of certain side groups protrude from
the α carbons. (C) Localization of fork loop-1 (green, Cα
model) according to its Zn-MAD density. Clear densities occurred
at a site opposite the rudder over the cleft, and they could
only be accounted for by fitting with fork loop-1. As shown by
the touching densities, fork loop-1 contacts the rudder to form
a set of “arms” that surrounds the DNA/RNA hybrid in the
ternary complex as has been noted (Westover et al., 2004b).
Residues involved in the contact are indicated. The bridge helix
defining the floor of the cleft is indicated as well.
(D
and E) (D) A motion by fork loop-1 can be seen from its
different locations in the free Pol II (red, Cα model) and in
ternary complexes (yellow and purple). The view is roughly from
the downstream side through the cleft and against the wall (not
visible here) of the hybrid tunnel. The rudder is shown in cyan,
and the rest of Pol II is shown in blue. The DNA template strand
is shown by the gray stick model, while the transcript RNA is
indicated by the pink sticks. The downstream DNA (gray sticks)
is roughly perpendicular to the plane of the paper. The dashed
line indicates a cut-away plane against which is the viewing
direction for (E). (E) Compartmentalization of the Pol II cleft
by the protein mass of fork loop-1 (red) and the rudder (white).
This is a cut-away view from the plane, as indicated in (D),
against the clamp domain of Rpb1. The surface rendering shows
the spatial arrangement of the hybrid tunnel and the downstream
DNA channel.
|
|
|
|
|
|
| |
The above figures are
reprinted
by permission from Cell Press:
Structure
(2006,
14,
973-982)
copyright 2006.
|
|
|
|
|
|
|
|
|
|
|
|
|
|
 |
 |
 |
|
Literature references that cite this PDB file's key reference
|
|
|
| |
PubMed id
|
|
Reference
|
|
|
|
|
|
S.S.Cha,
Y.J.An,
C.S.Jeong,
M.K.Kim,
S.G.Lee,
K.H.Lee,
and
B.H.Oh
(2012).
Experimental phasing using zinc anomalous scattering.
|
| |
Acta Crystallogr D Biol Crystallogr,
68,
1253-1258.
|
|
|
PDB codes:
|
|
|
|
|
|
|
|
B.P.Pedersen,
J.P.Morth,
and
P.Nissen
(2010).
Structure determination using poorly diffracting membrane-protein crystals: the H+-ATPase and Na+,K+-ATPase case history.
|
| |
Acta Crystallogr D Biol Crystallogr,
66,
309-313.
|
|
|
|
|
|
|
P.A.Meyer,
P.Ye,
M.H.Suh,
M.Zhang,
and
J.Fu
(2009).
Structure of the 12-Subunit RNA Polymerase II Refined with the Aid of Anomalous Diffraction Data.
|
| |
J Biol Chem,
284,
12933-12939.
|
|
|
PDB code:
|
|
|
|
|
|
|
The most recent references are shown first.
Citation data come partly from CiteXplore and partly
from an automated harvesting procedure. Note that this is likely to be
only a partial list as not all journals are covered by
either method. However, we are continually building up the citation data
so more and more references will be included with time.
Where a reference describes a PDB structure, the PDB
codes are
shown on the right.
|
| | |


 Links
Links


