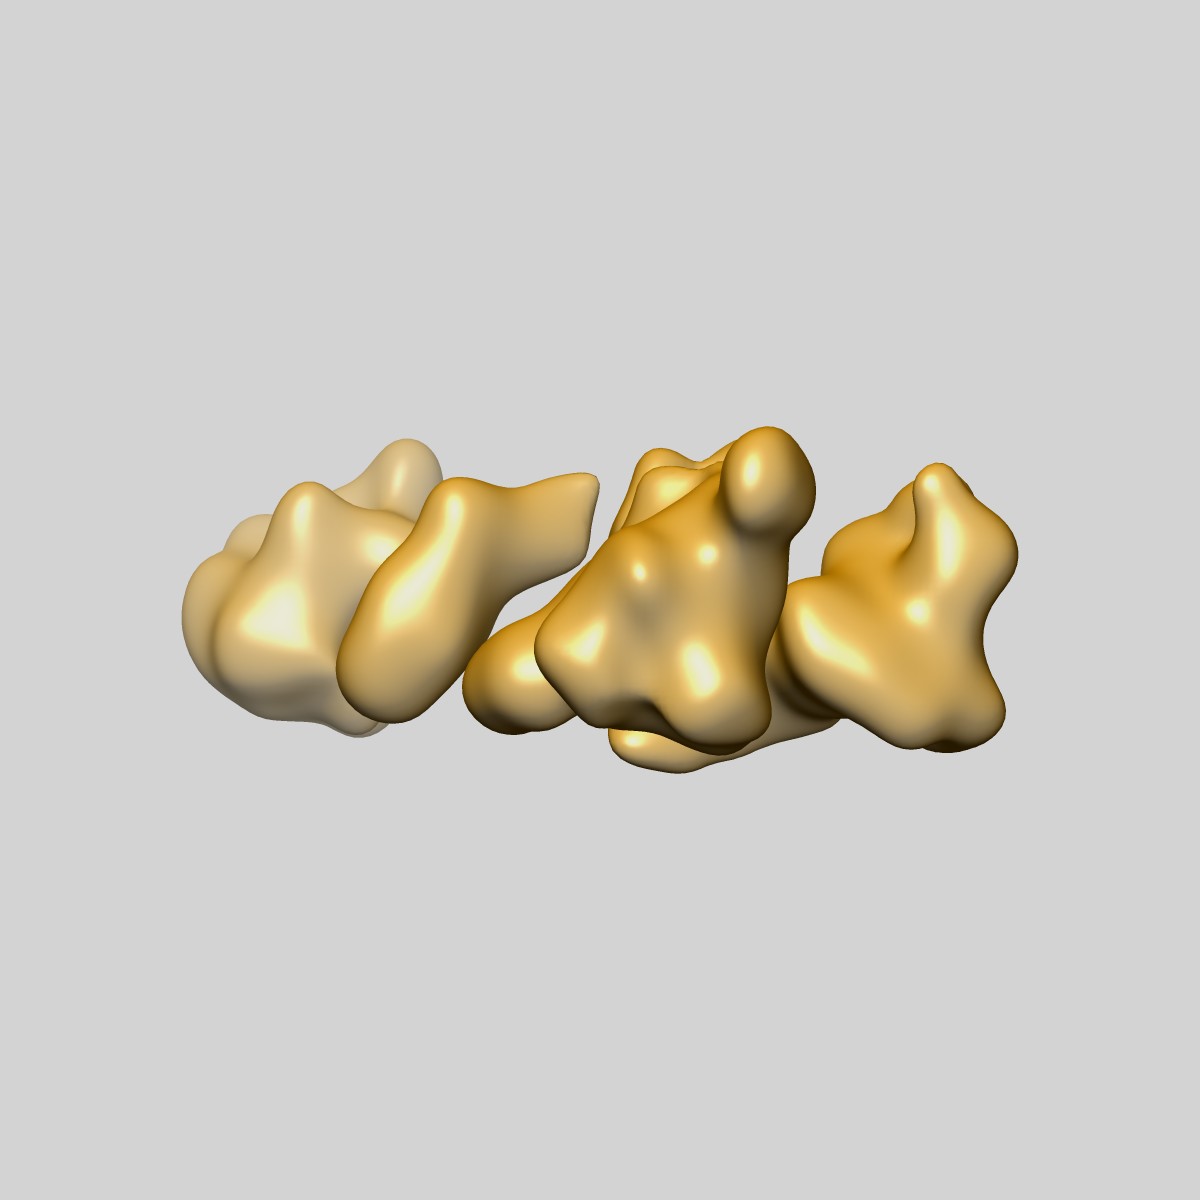
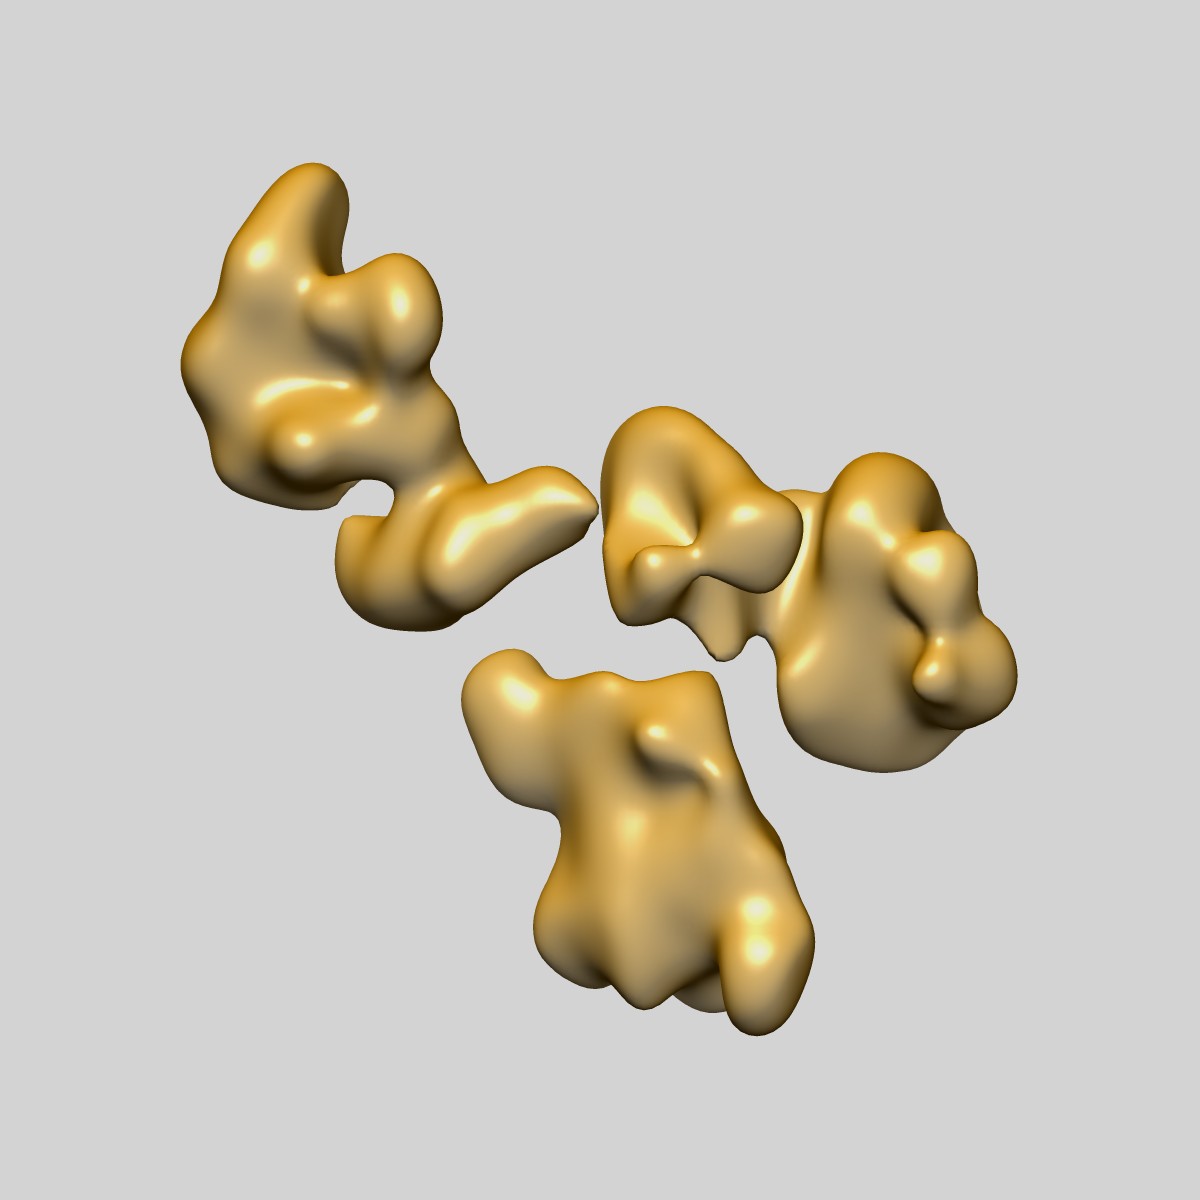
EMD-2286
3D map of another peptide conjugated antibody particle by individual-particle electron tomography (IPET) and optimized negative-staining.
EMD-2286
Tomography16.6 Å
 Deposition: 18/01/2013
Map released: 30/01/2013
Last modified: 06/02/2013
Concentration: 0.01
mg/mL
Buffer
pH: 7.4
Details: 1X Dulbeccos phosphate-buffered saline (Invitrogen, La Jolla, CA), 2.7 mM KCl, 1.46 mM KH2PO4, 136.9 mM NaCl, and 8.1 mM Na2HPO4
Details: 1X Dulbeccos phosphate-buffered saline (Invitrogen, La Jolla, CA), 2.7 mM KCl, 1.46 mM KH2PO4, 136.9 mM NaCl, and 8.1 mM Na2HPO4
Staining
Type:
NEGATIVE
Details: EM Specimens were prepared by optimized negative-staining EM specimen preparation protocol as described Zhang L. and Ren G, Journal of Lipid Research, (2010) 51, 1228-1236; (2011) 52, 175-84 and BBA (2013) 1830, 2150-9. In brief, antibody was diluted to 0.01 mg/ml with deionized water. Aliquots (about 3ul) were applied to the 200 mesh glow-discharged thin carbon-coated EM grids (Cu-200CN, Pacific Grid-Tech, USA). The grid was washed by deionized water for three times, and then washed by 1% uranyl formate for three times before blotting to drying.
Details: EM Specimens were prepared by optimized negative-staining EM specimen preparation protocol as described Zhang L. and Ren G, Journal of Lipid Research, (2010) 51, 1228-1236; (2011) 52, 175-84 and BBA (2013) 1830, 2150-9. In brief, antibody was diluted to 0.01 mg/ml with deionized water. Aliquots (about 3ul) were applied to the 200 mesh glow-discharged thin carbon-coated EM grids (Cu-200CN, Pacific Grid-Tech, USA). The grid was washed by deionized water for three times, and then washed by 1% uranyl formate for three times before blotting to drying.
Grid
Details: 200 mesh glow-discharged thin carbon-coated EM grids (Cu-200CN, Pacific Grid-Tech, USA)
Microscope: ZEISS LIBRA120PLUS
Illumination mode: FLOOD BEAM
Imaging mode: BRIGHT FIELD
Electron source: LAB6
Acceleration voltage: 120 kV
Nominal CS: 2.2 mm
Nominal defocus: 1.0 µm - 2.0 µm
Nominal magnification: 80000.0
Specimen holder model: OTHER
Specimen holder details: Gatan
Details: Tilt step is 1.5 degree
Illumination mode: FLOOD BEAM
Imaging mode: BRIGHT FIELD
Electron source: LAB6
Acceleration voltage: 120 kV
Nominal CS: 2.2 mm
Nominal defocus: 1.0 µm - 2.0 µm
Nominal magnification: 80000.0
Specimen holder model: OTHER
Specimen holder details: Gatan
Details: Tilt step is 1.5 degree
Image Recording
[1]
Detector category:
CCD
Detector model: GATAN ULTRASCAN 4000 (4k x 4k)
Sampling interval: 1.406 µm
Number of real images: 95
Average electron dose per image: 250 e/Å2
Bits per pixel: 16.0
Detector model: GATAN ULTRASCAN 4000 (4k x 4k)
Sampling interval: 1.406 µm
Number of real images: 95
Average electron dose per image: 250 e/Å2
Bits per pixel: 16.0
Tilt Series
[1]
| Axis 1 | Axis 2 | |||||
|---|---|---|---|---|---|---|
| Min. | Max. | Inc. | Min. | Max. | Inc. | Rotation |
| -70.5 ° | 70.5 ° | 1.5 ° | - | - | - | - |
Microscope: FEI TECNAI 20
Illumination mode: FLOOD BEAM
Imaging mode: BRIGHT FIELD
Electron source: LAB6
Acceleration voltage: 200 kV
Nominal CS: 2.0 mm
Nominal defocus: 1.0 µm - 2.0 µm
Nominal magnification: 80000.0
Specimen holder model: OTHER
Specimen holder details: Gatan
Details: Tilt step is 1.5 degree
Illumination mode: FLOOD BEAM
Imaging mode: BRIGHT FIELD
Electron source: LAB6
Acceleration voltage: 200 kV
Nominal CS: 2.0 mm
Nominal defocus: 1.0 µm - 2.0 µm
Nominal magnification: 80000.0
Specimen holder model: OTHER
Specimen holder details: Gatan
Details: Tilt step is 1.5 degree
Image Recording
[1]
Detector category:
CCD
Detector model: GATAN ULTRASCAN 4000 (4k x 4k)
Sampling interval: 1.406 µm
Number of real images: 95
Average electron dose per image: 250 e/Å2
Bits per pixel: 16.0
Detector model: GATAN ULTRASCAN 4000 (4k x 4k)
Sampling interval: 1.406 µm
Number of real images: 95
Average electron dose per image: 250 e/Å2
Bits per pixel: 16.0
Tilt Series
[1]
| Axis 1 | Axis 2 | |||||
|---|---|---|---|---|---|---|
| Min. | Max. | Inc. | Min. | Max. | Inc. | Rotation |
| -70.5 ° | 70.5 ° | 1.5 ° | - | - | - | - |
Details: Reconstruction was done by Individual-Particle Tomography Reconstruction (IPET) method.{eulerAnglesDetails}: Tomography tilt angle from -70.5 to 70.5 in step of 1.5
Final
reconstruction
Resolution: 16.6
Å
(
BY AUTHOR)
Resolution method: OTHER
Number of images used: 95
Algorithm: OTHER
Details: Map was reconstructed by individual-particle electron tomography (IPET)and Focus ET Reconstruction Algorithm.
Resolution method: OTHER
Number of images used: 95
Algorithm: OTHER
Details: Map was reconstructed by individual-particle electron tomography (IPET)and Focus ET Reconstruction Algorithm.
Software
[1]
| Name | Version | Details |
|---|---|---|
| Individual-partcile, electron, tomogrphy, (IPET), and, FETR | - | - |
CTF correction
Details:TOMOCTF
Format: CCP4
Data type: IMAGE STORED AS FLOATING POINT NUMBER (4 BYTES)
Annotation details: Reconstruction of another IgG1 antibody by Individual-Particle Electron Microscopy (IPET).
Details: ::::EMDATABANK.org::::EMD-2286::::
Data type: IMAGE STORED AS FLOATING POINT NUMBER (4 BYTES)
Annotation details: Reconstruction of another IgG1 antibody by Individual-Particle Electron Microscopy (IPET).
Details: ::::EMDATABANK.org::::EMD-2286::::
⬡ Geometry
| X | Y | Z | |
|---|---|---|---|
| Dimensions | 200 | 200 | 200 |
| Origin | -3 | -6 | -4 |
| Spacing | 200 | 200 | 200 |
| Voxel size | 1.406 Å | 1.406 Å | 1.406 Å |
Contour list
| Primary | Level | Source |
|---|---|---|
| True | 0.9 | AUTHOR |