Swat et al. (2004), Bifurcation analysis of the regulatory modules of the mammalian G1/S transition
February 2010, model of the month by Lukas Endler
Original model: BIOMD0000000228
| The cell division cycle is a tightly controlled sequence of processes, and small aberrations in both sequence and control can have fatal consequences for an organism. In eukaryotic cells, in general the cell cycle can be divided into four distinct phases: the DNA synthesis or S phase, during which the genetic material is duplicated, M phase, during which the genetic material is divided (mitosis) and which ends with the actual division of the nucleus and finally the cell (cytokinesis), and two variable gap phases, G1 and G2, between the S and M phases (Fig 1). There exists a number of checkpoints, at least one in each phase, that control the correct sequence of events and commit the cell to proceed or stop its progression through the cell cycle. The two checkpoints lying at the end of the G1 and the G2 phases are of special importance, as they commit the cell to start proliferating and to finally enter the cell division phase. General factors important for the progression in cell cycle, such as environmental conditions, potential DNA damage , completeness of replication and cell size, are involved in the decision process at these points. The checkpoint controlling the commitment to enter S phase, also called restriction point in mammals or start in yeast, is of special importance in multicellular organisms, as the cell proliferation has to be coordinated. Some cells change into a non-proliferative state from G1, termed G0, and normally only pass the restriction point after receiving special triggers such as growth factors or other exterior signals [3]. Perturbations of these control mechanisms can lead to cancer and developmental deformations, as well as lead to problems in tissue regeneration, making their understanding of fundamental importance both in the treatment of cancer and stem cell research. The complexity of cell cycle control and the intricate interplay of the different processes and factors involved has lead to the development of quite a number of mathematical models, especially for budding and fission yeast (see eg. BIOMD0000000056 or BIOMD0000000111). In their article Swat et al. ([1], BIOMD0000000228) concentrate on the restriction point and how the structure of underlying control mechanisms influences the decision to pass it. They use models with increasing layers of control (Fig 2), based on a model proposed by Kel et al [2]. To analyse the qualitative behaviour of their models, they use bifurcation analysis to find changes of the number and stability of steady states of the system with varying parameters, such as degradation rates and external growth factor signals. Bifurcation analysis is especially helpful to find multistability, switch like behaviour and oscillations. Swat et al. start from a small core unit of two key players involved in G1/S transition, the transcriptional activator E2F1 and the tumor suppressor pRB [4]. E2F1 is important for cell cycle progression and controls a large set of target genes, some needed for DNA replication, such as the DNA polymerase subunits alpha and delta and the H2A histone, proteins involved in apoptosis, such as BAD1 and BAK1, as well as regulatory proteins like the D and E cyclins and pRB. It also has an auto-regulatory function enhancing the expression of both E2F1 and 2. In the article and for the model, the level of E2F1 expression is treated as the main indicator for passing the G1/S transition. pRB on the other hand has a negative influence on passing the restriction point by binding E2F1 and other proteins of this family and repressing transcription of their target genes. In the core model (Fig 3A), this inhibitory effect leads to a negative feedback of E2F1 on its own expression via pRB. As pRB also inhibits its own expression, and the intertwined negative and positive feedback loops of E2F1 lead to beautiful switching behaviour in dependence of the pRB degradation rate (Fig 3B). In the bistable region a low level of E2F1 stays stable, while a sudden increase of E2F1 lets the activation of E2F1 transcription overcome the repression by pRB, which exerts a negative feedback both on itself and E2F1, and to a sustained high expression of E2F1. Another model concerning also a decision in cell proliferation, though in stem cell differentiation, can be found in BIOMD0000000209 and BIOMD0000000210. There the switching behaviour was a result of only positive feedback loops. |  Figure 1: Schematic representation of the mammalian cell division cycle and some of the factors influencing its progression through the G1/S and G2/M checkpoints. Figure taken from Wikipedia |
 Figure 2: The core module and its extensions as used in the article. Active forms are white, while grey and dark grey indicate increasing degrees of inactivation. Non-small cell lung cancer. Figure taken from [1] | pRB is phosphorylated and its affinity to E2F decreased by cyclin dependent kinases (CDKs) in complex with the D and E cyclins, cycD/cdk4,6 and cycE/cdk2, at the end of G1 phase. Also, the restriction point is controlled by external signals in mammalian cells, such as growth factors. Some of these external signals lead to an activation of the transcription factor AP-1, for example via the Erk and Jnk MAP kinase signal transduction pathways. AP-1 is a heterodimer mainly composed of cFos, cJun and the ATF family of proteins and some forms of it activate transcription of factors that enhance proliferation and cell cycle progression, such as D cyclins. The full model in the article considers the growth factor stimulus to proliferate via enhancing AP-1 formation and increasing CycD/cdk4,6 activity. In extending the core model with the CycD/cdk4,6 and AP-1 module, it is possible to directly include growth factor and other proliferation stimuli via two parameters. Fm, a factor directly leading to increased AP-1 formation, can be seen for example as increased Jnk and Erk activity after stimulation of the cell with growth factor. Using this mitogenic stimulus, Fm, as a bifurcation parameter the authors found two big changes in the models behaviour (Fig 4). First, the concentration of E2F1 does not change at all with increasing Fm, which is what would be expected for cells in G0 with only weak or basal stimulation. At a certain threshold of Fm the system undergoes a transcritical bifurcation and the E2F1 equilibrium concentration steadily increases with the stimulus. The authors liken this point to the restriction point (R-point) even though it is not the irreversible commitment to change from G1 to S phase. Further increase of Fm leads to a saddle node bifurcation again via a bistable region. After the stimulation strength surpasses the bistable range, the system switches to the state of high E2F1 expression, while within this range an increase in E2F1 or a decrease in pRB can lead to a change from the low to the high state. A second and final extension to the system is the inclusion of the CycE/cdk2 complex and its inhibition of pRB function by additional phosphorylation, which considers yet another feedback loop in this system. This full system was further analysed to elucidate the influences of two positive feedback cycles, the one over AP-1 via altering k25, the activation constant of AP-1 by E2F1 and the auto-activation CycD/cdk4,6 by changing the half activation constant Km4. Both parameters do not influence the transcritical bifurcation, but change the bistable region quite dramatically (Fig 5). Decreasing Km4, that is increasing the auto-activation of CycD/cdk4,6 at lower levels of its active form, shifts the whole bistable regions and the point of no return in direction of low mitogenic stimulus. Increasing k25 on the other hand leaves the point of no return at roughly the same stimulus strength, but shifts the bistable region until it becomes it extends into negative values of Fm and the switch becomes irreversible. This means once the system has switched to the state of high expression of E2F1, it remains there, even if the mitogenic stimulation ceases. The article illustrates how complex behaviours can arise from added layers of positive and negative feedbacks. As bifurcation analysis goes over ranges of parameters and does not consider the short term dynamics of a system, it is also an excellent tool for systems with scarcely defined parameters. While the parameters and some of the interactions used in the model are not well characterized yet, the qualitative behaviour is a quite stable result of the interconnected feedback loops and the predictions made for the model can be compared to and trigger experiments to gain new insights. |
 Figure 3: The core module consisting only of E2F1 and pRB (A). It shows bistability in dependence of the degradation rate of pRB (ΦpRB). Figure taken from [1]  Figure 4: Bifurcation diagram of the system with the first extension in dependence of Fm, the mitogenic stimulus. Figure taken from [1] | 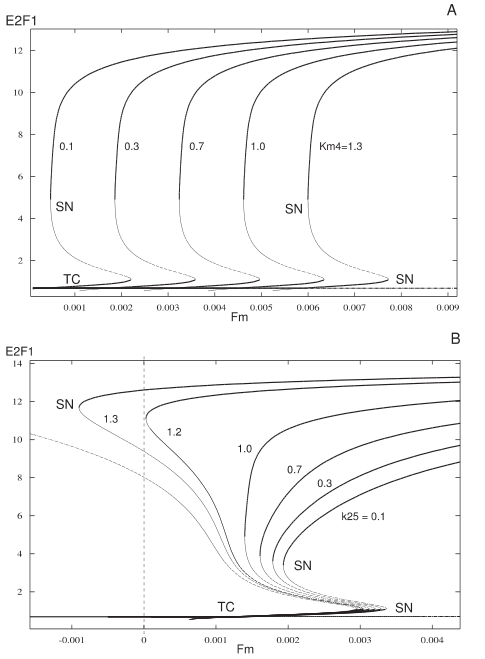 Figure 5: Bifurcation diagram of the full system to illustrate the influences of varying feedback strength via the CycD/cdk4,6 auto-activation (A, parameter Km4) and the AP-1 stimulation by E2F1 (B, k25). Figure taken from [1] |
Bibliographic References
- Swat M, Kel A, Herzel H. Bifurcation analysis of the regulatory modules of the mammalian G1/S transition. Bioinformatics. 2004 Jul 10;20(10):1506-11. [CiteXplore]
- Kel A, Deineko I, Kel-Margoulis O, Wingender E and Ratner V. Modelling of Gene Regulatory Networks of Cell Cycle Control. Role of E2F Feedback Loops. German Conference on Bioinformatics,GCB 2000 pp107-114 [GCB 2000]
- Massagué J. G1 cell-cycle control and cancer. Nature. 2004 Nov 18;432(7015):298-306. [CiteXplore]
- Poznic M. Retinoblastoma protein: a central processing unit. J Biosci. 2009 Jun;34(2):305-12. [CiteXplore]